I recently wanted to build a data visualisation app. Because the visualisation was the key part that I was interested in, I didn't want the overhead of developing separate native iOS and Android apps. Hybrid frameworks like Cordova were the natural answer, but they weren't great for data visualisation. Flutter, a promising new hybrid framework, offered me a way around this. In this article, I explain why I made this decision and how I developed my app with Flutter.

Building on an interest
I enjoy learning about data visualisations and have previously written data visualisation posts with OfferZen.
What I enjoy most about these visualisations is that they can help you see your data in different ways, which can then prompt new questions regarding the data you just processed.
For example, when I implemented the visualisation for company sizes against technology stacks, I was surprised that Java was being used by startups as well as larger companies. This caused me to ask more questions about the data, such as why is Java popular with startups but not with medium sized companies? I find this post-visualisation questioning of data to be very rewarding, as it continuously sparks new ways of thinking.
Following on from what I had previously done, I was curious about how I could apply data visualisation theory to mobile devices. The data set that I had in mind was the same "Technology Stack vs Company Sizes" data that I had used before in my previous post.
Using a data set that I had already worked with allowed me to focus specifically on the data visualisation, and not on the specifics of how to scrape/parse data. This focus meant that I could spend time exploring a new mobile framework called Flutter, because I had already laid all the ground work that I needed to.
Flutter works with both Android and iOS. This made it the ideal program to use for this project as it slotted in with one of my main goals: learning one framework instead of two big platforms and their tooling.
My aim then was to:
- Build a simple mobile application as quickly as possible that would work with both Android and iOS.
- Display a bar graph and explore the results.

So, what is Flutter?
Flutter is an open source mobile framework software development kit (SDK) created by Google. It was previously known as the "Sky" framework, and was unveiled during the 2015 Dart Developer Summit.
Flutter describes itself as a framework that allows you to build native apps from one codebase. When building mobile applications, the general desire is to target all your popular platforms i.e. Android and iOS. To be able to do this, you need two codebases, one for each platform.
When using Flutter, however, you only need one codebase to target your platforms.
Especially for a team of one, this has the benefit of supporting less code, and also makes it easier to achieve feature parity on all of your mobile platforms.
If you have two codebases, feature parity is harder because the frameworks involved have different nuances.
Something important to note, once I had installed Flutter, I realised that I would have to work with Dart. I had no experience with this language but the syntax was very similar to JavaScript.
The experience using Flutter was smooth and easy. The data visualisation was clean and inspired me to want to explore more. Below, I will walk you through the process I went through to generate my app so that you can build one of your own too.
Setting yourself up
The workflow for setting yourself up with Flutter is as follows:
- Get the Flutter SDK.
- Run a tool called flutter doctor. This is a super neat tool that scans your environment and tells you what you need to install to get up and running. For example, the Visual Studio Code plugin is not installed, the Flutter SDK is not installed, etc.
- Fix the errors from the flutter doctor. This normally entails either installing a new tool/plugin (e.g. Visual Studio Code) or configuring your environment (adding environment variables).
- Install a simulator. The default in the documentation is to use an Android emulator, but an iOS emulator can also be used.
- Set up your editor (Android Studio/IntelliJ or Visual Studio Code).
- Do a final check with flutter doctor.
- Done!
I recommend following the install guide if you get stuck as it is very well documented.
Let's code!
Create a basic application using your Integrated Development Environment (IDE)
The first step is to set up a workspace in which to build your application.
For simplicity, the following steps will be shown in IntelliJ/Android Studio, but the same code still applies should you choose to use Visual Studio Code.
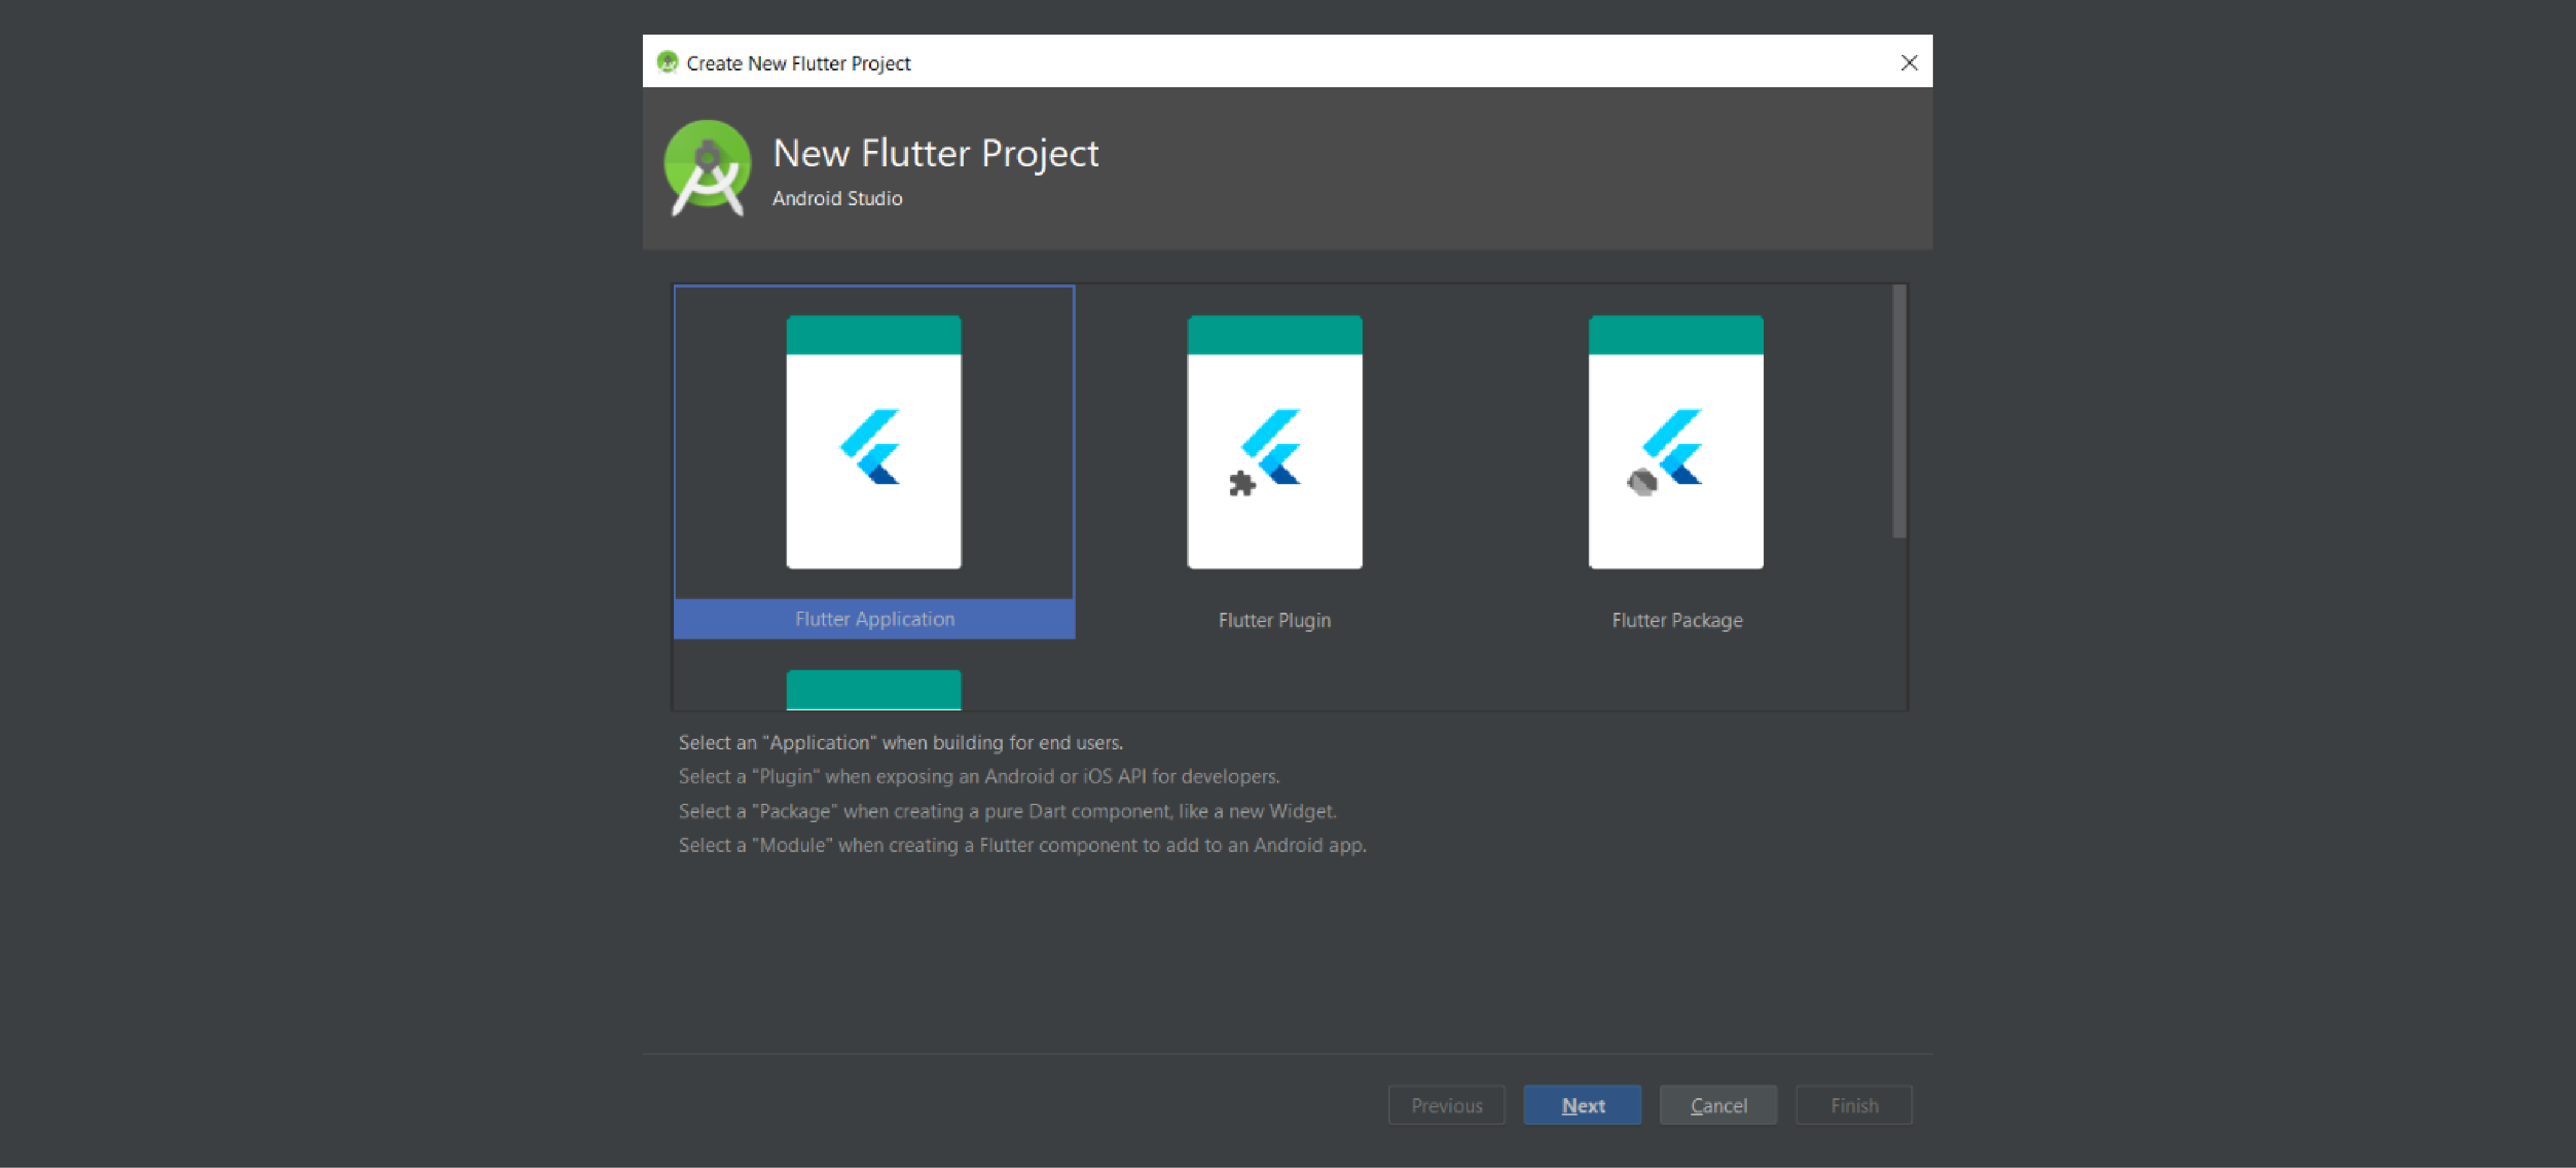
Wizard Step 1: Specify the Project Type
Here, we are building a Flutter application, so we select this option. The Android Studio plugin defines this as application that is targeting an end user.
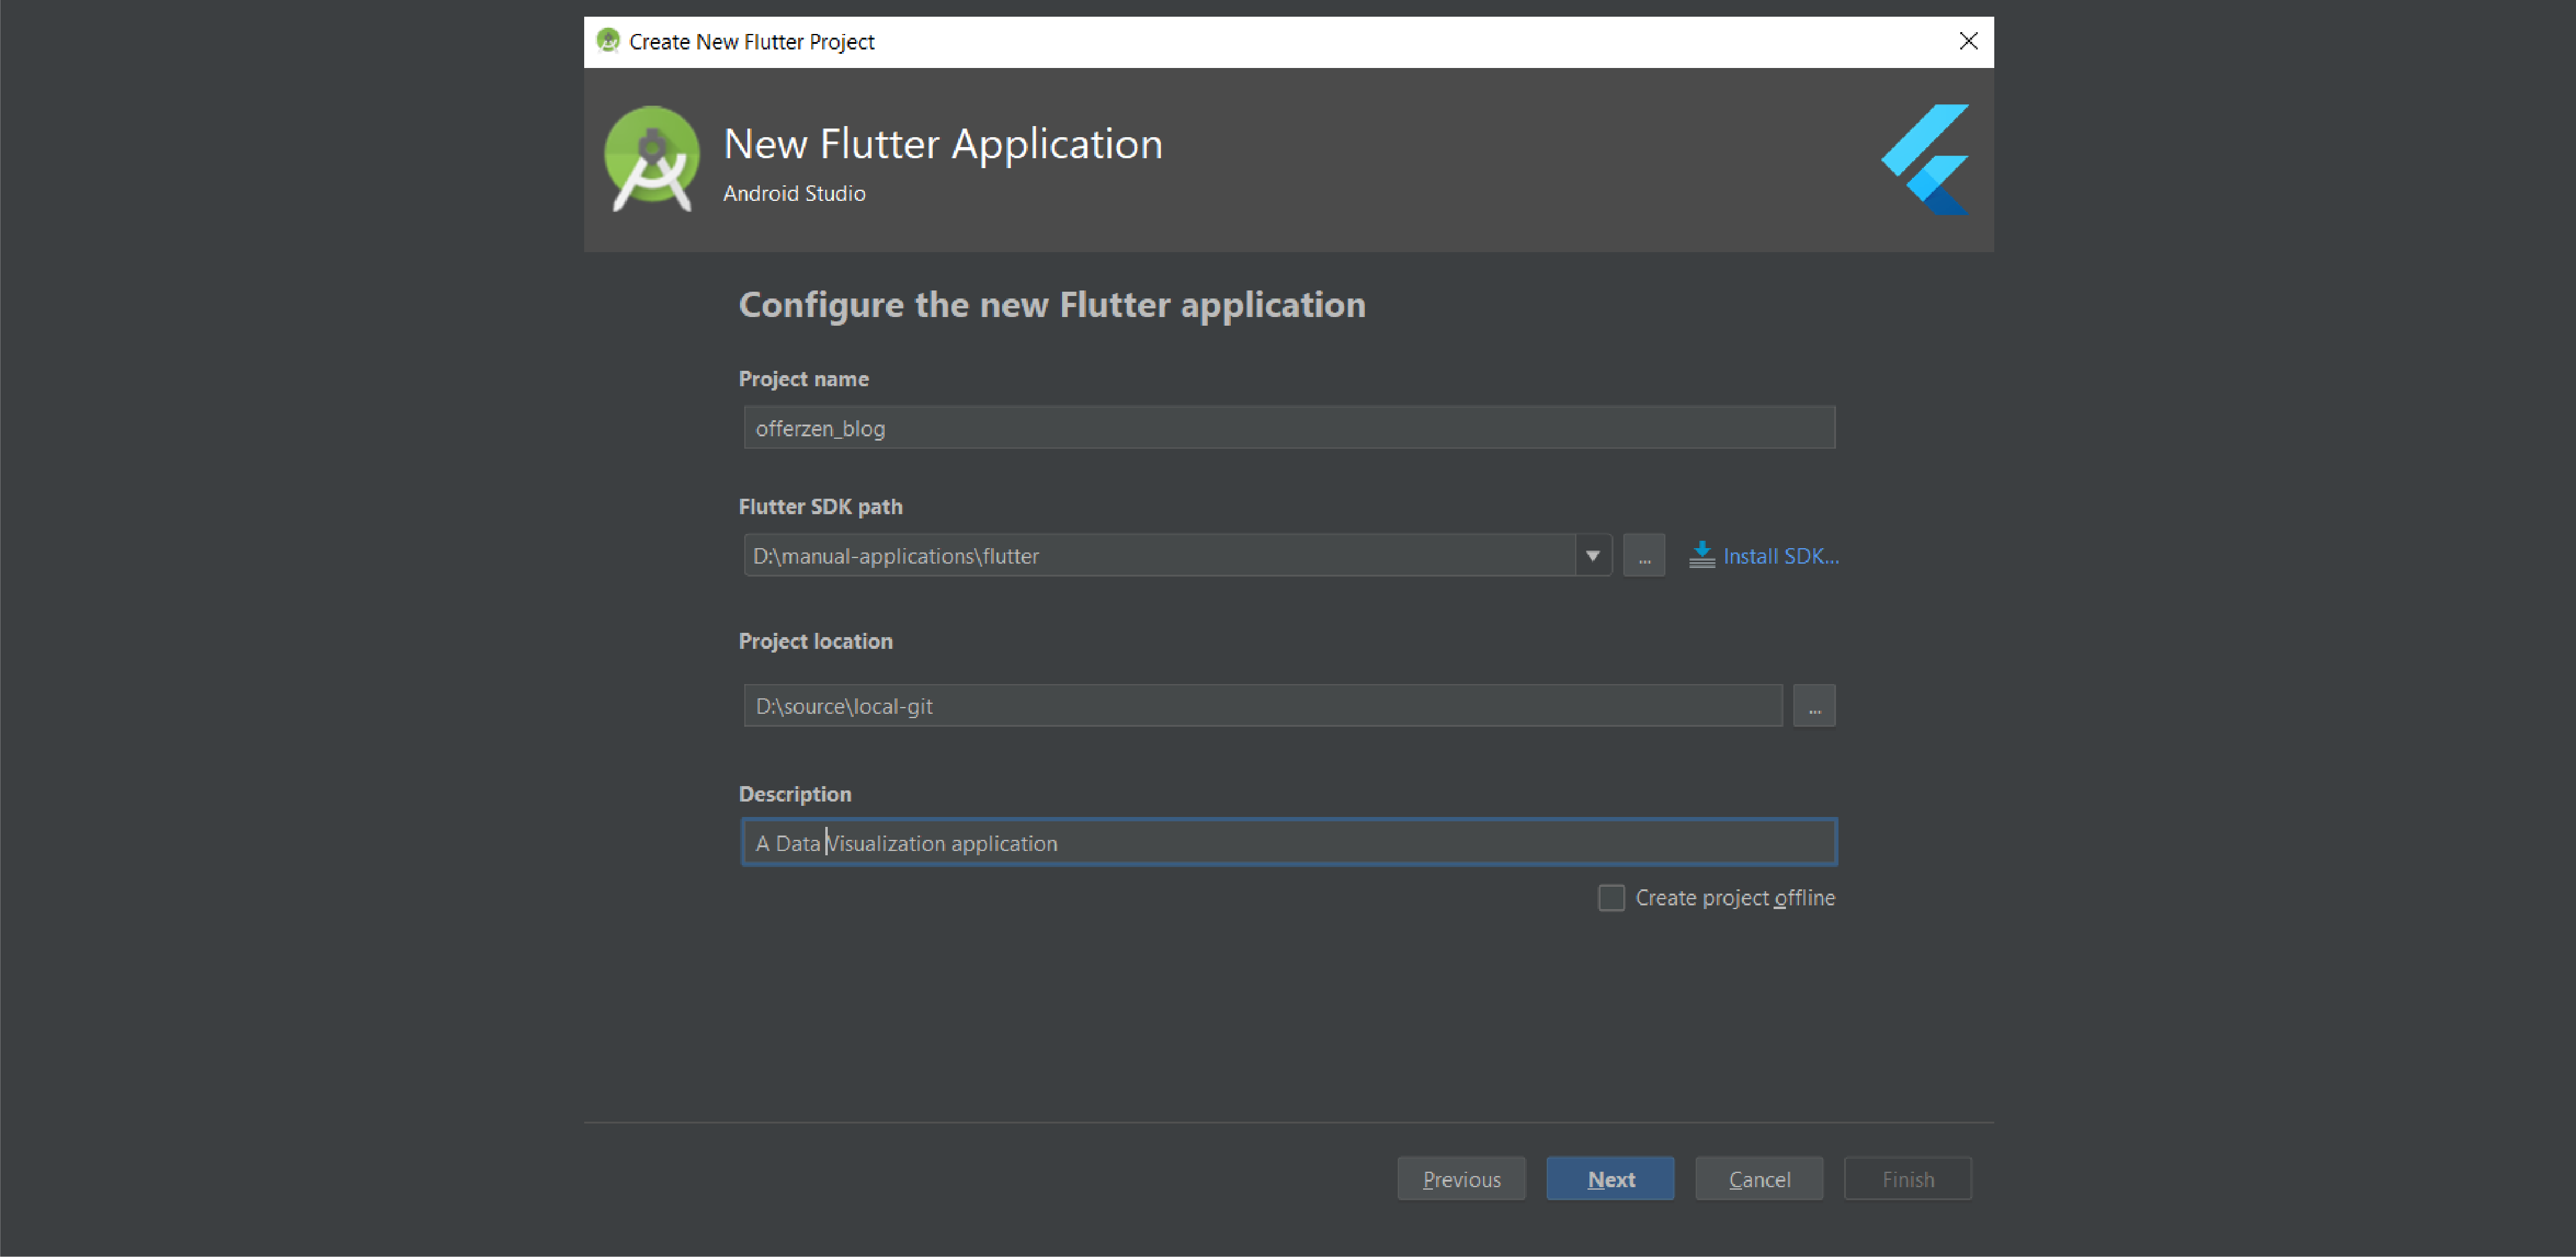
Wizard Step 2: Project Metadata
In this step, we add some metadata to the project. We specify a project name, the Flutter SDK path, project locations and a description. This should be very familiar to something you'd see on npm, gradle or maven.
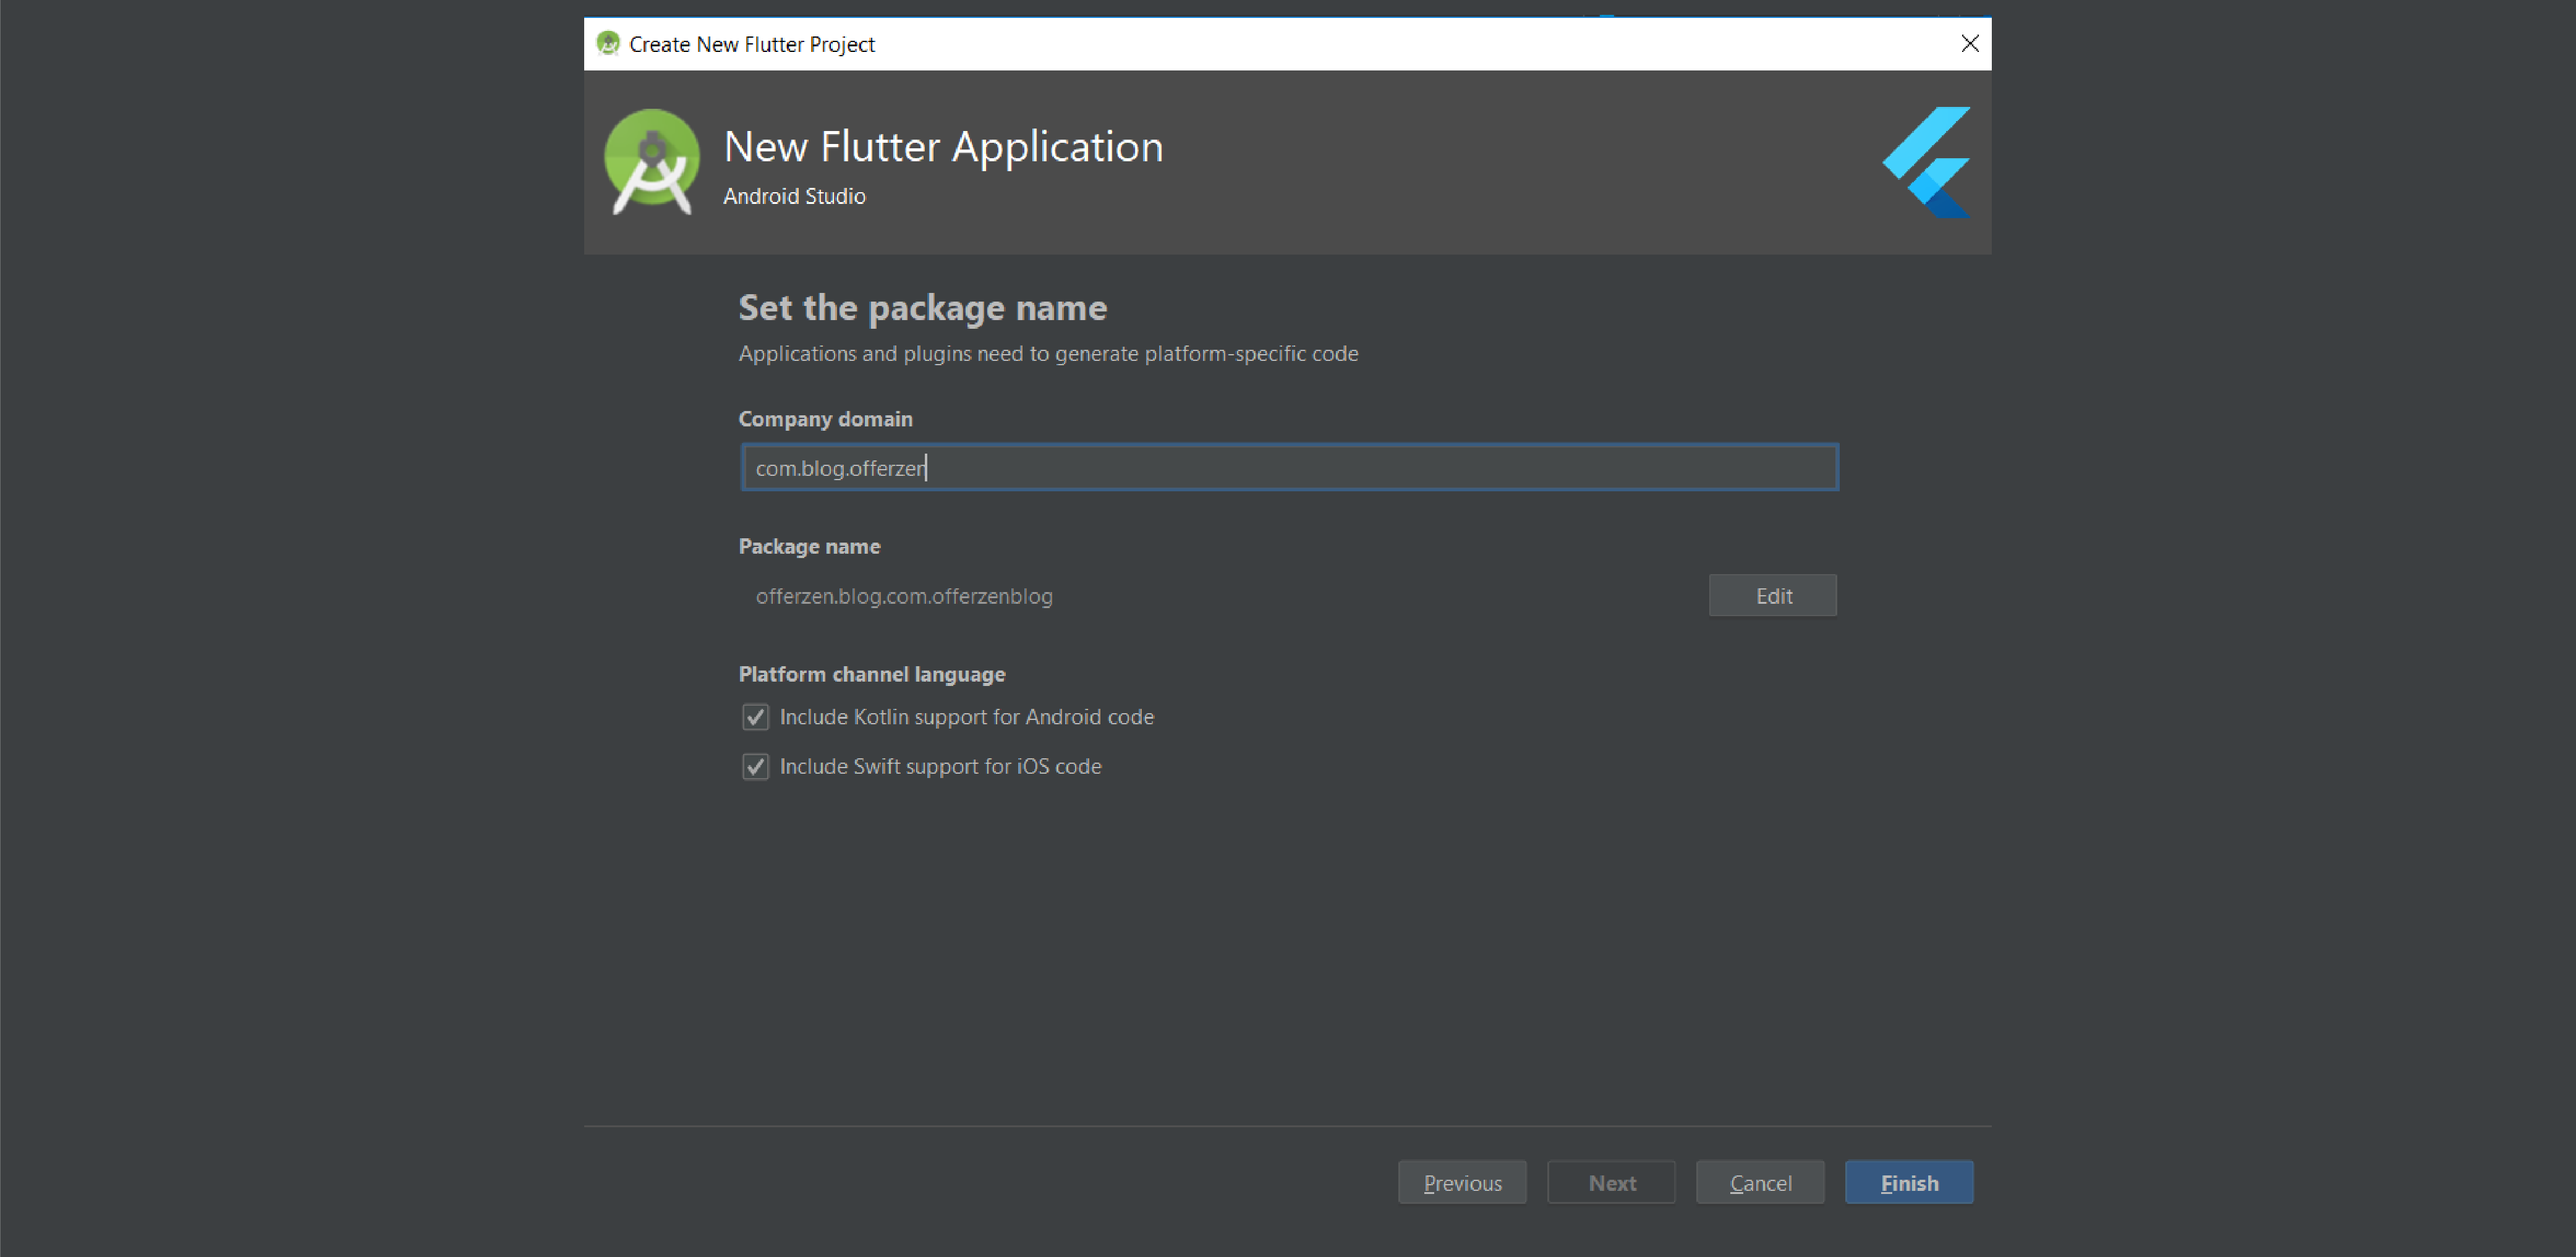
Wizard Step 3: More Metadata
In the final step, we provide a domain and specify some language support options. The language support options are outside the scope of this post, but essentially one is able to write some platform native code in certain use cases.
In this case, the field of interest is the company domain name, which could be any name you like.
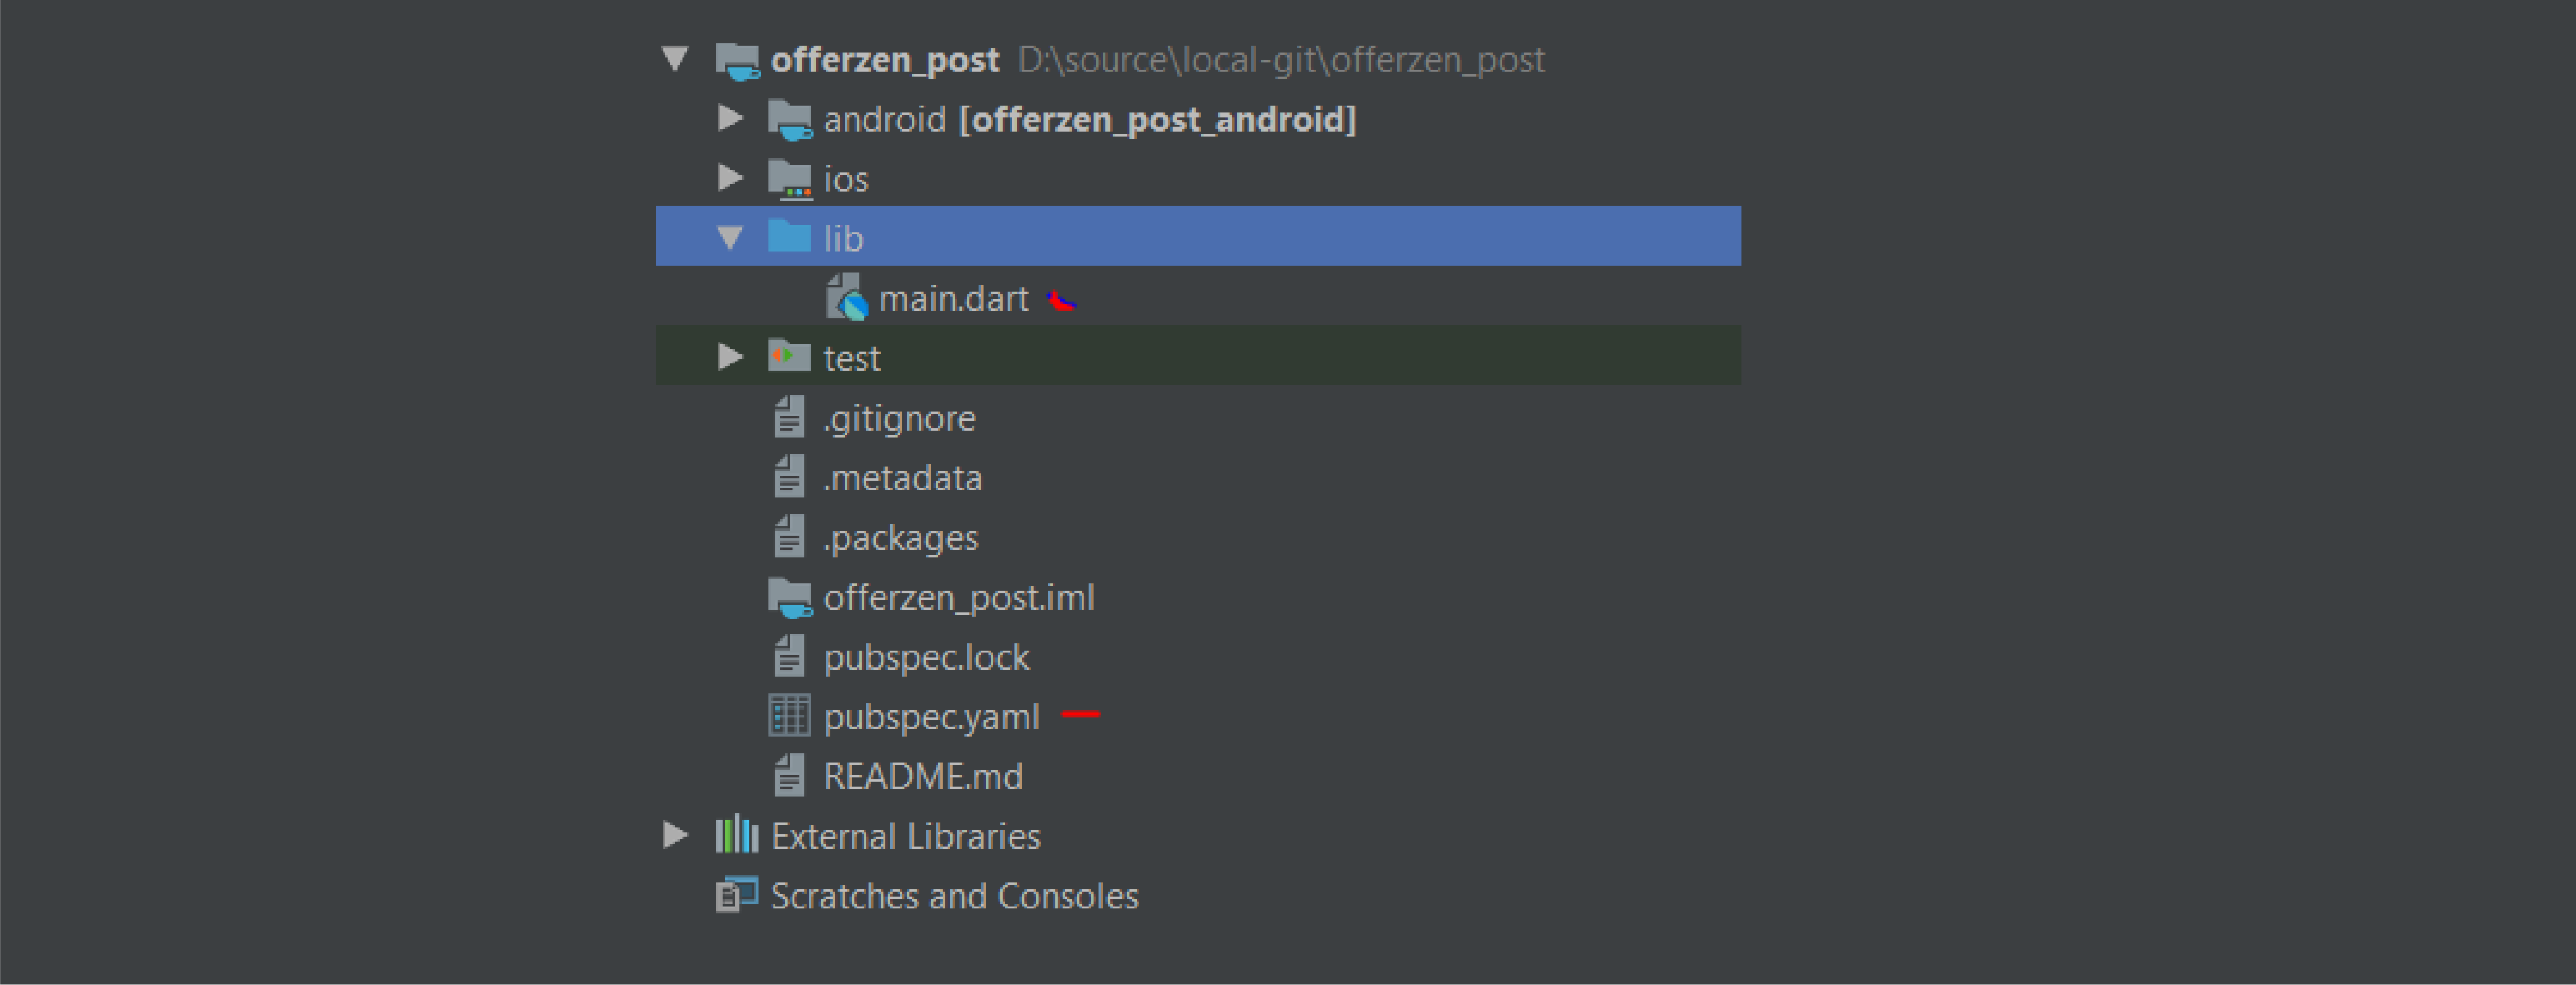
Project Layout:
This generates the following layout along with these files. The red marks on the image are the main files that we will be working with, main.dart and pubspec.yaml.
Add the Data Visualisation Package
The next step is to add the data visualisation package. Flutter stores all of its dependency information in a file called pubspec.yaml. For familiarity, you can think of it as a package.json file or a pom file.
We add the charts_flutter package to the list of dependencies and run a packages get command so that our project can recognise these dependencies in the project:
dependencies:
 flutter:
   sdk: flutter
 charts_flutter: ^0.5.0
Tip: Flutter has an online repository that allows you to search for packages to use in your project. This made finding a data visualisation framework a trivial task.
Replace the starter code with something more understandable
The generated Flutter code can look a bit daunting to people who are completely new to Flutter. Unless you've read the online documentation, it's easy to feel lost. For this reason, we make it simpler with the following starter code:
import 'package:flutter/material.dart';

//Main method for all Flutter Applications
void main() => runApp(MyApp());

/**
* This class is the root Widget of the application. It will be composed
* of other widgets.
*/
class MyApp extends StatelessWidget {
 // This widget is the root of your application.
 @override
 Widget build(BuildContext context) {
   return MaterialApp(
     title: 'Flutter Demo',
     theme: ThemeData(
       primarySwatch: Colors.blue,
     ),
     home: Visualization(),
   );
 }
}

/**
* This is a visualization widget that will build our visualization
*/
class Visualization extends StatelessWidget {
 @override
 Widget build(BuildContext context) {
   {
     return Scaffold(
       appBar: AppBar(
         title: Text('Offerzen App'),
       ),
       body: Center(
         child: Column(
           mainAxisAlignment: MainAxisAlignment.center,
           children: <Widget>[
             Text('Hello')
           ],
         ),
       ),
     );
   }
 }
}
Code Snippet Notes
- All Flutter applications have a
main()function. This will run a Flutter SDK function calledrunApp()that takes a root widget as a parameter. In this case, this isMyApp. - Flutter works with the concept of
StatefulWidgetandStatelessWidget. A StatelessWidget is exactly what it says it is: a widget that does not hold state. It also needs to implement abuild()function. Getting into StatefulWidgets is beyond the scope of this project. - We use two Stateless widgets for our application: MyApp, which is sort of a bootstrap class and Visualization, which will hold our visualisation.
At this point, you can simply run the application and Flutter's hot reloading feature should be able to reflect the changes without the need to fully build the app.
If you've ever tried to develop mobile applications before, the workflow is typically to code your changes, run a full build and then deploy the application to your simulator/test device. This is typically a long process just to test your changes.
Flutter has a feature that allows you to make your changes and view the results on save. This will be a familiar process if you've worked on a JavaScript framework before.
While there are cases where you need to do a full build around 20% of the time, the rest of the time you can hit save on your IDE and see the changes instantly. This encourages exploration and fast failure, which are good attributes to have in a framework.
Implementing our Data Visualisation
In this section, we will implement our intended data visualisation. For reference, we are aiming for a visualisation similar to this:
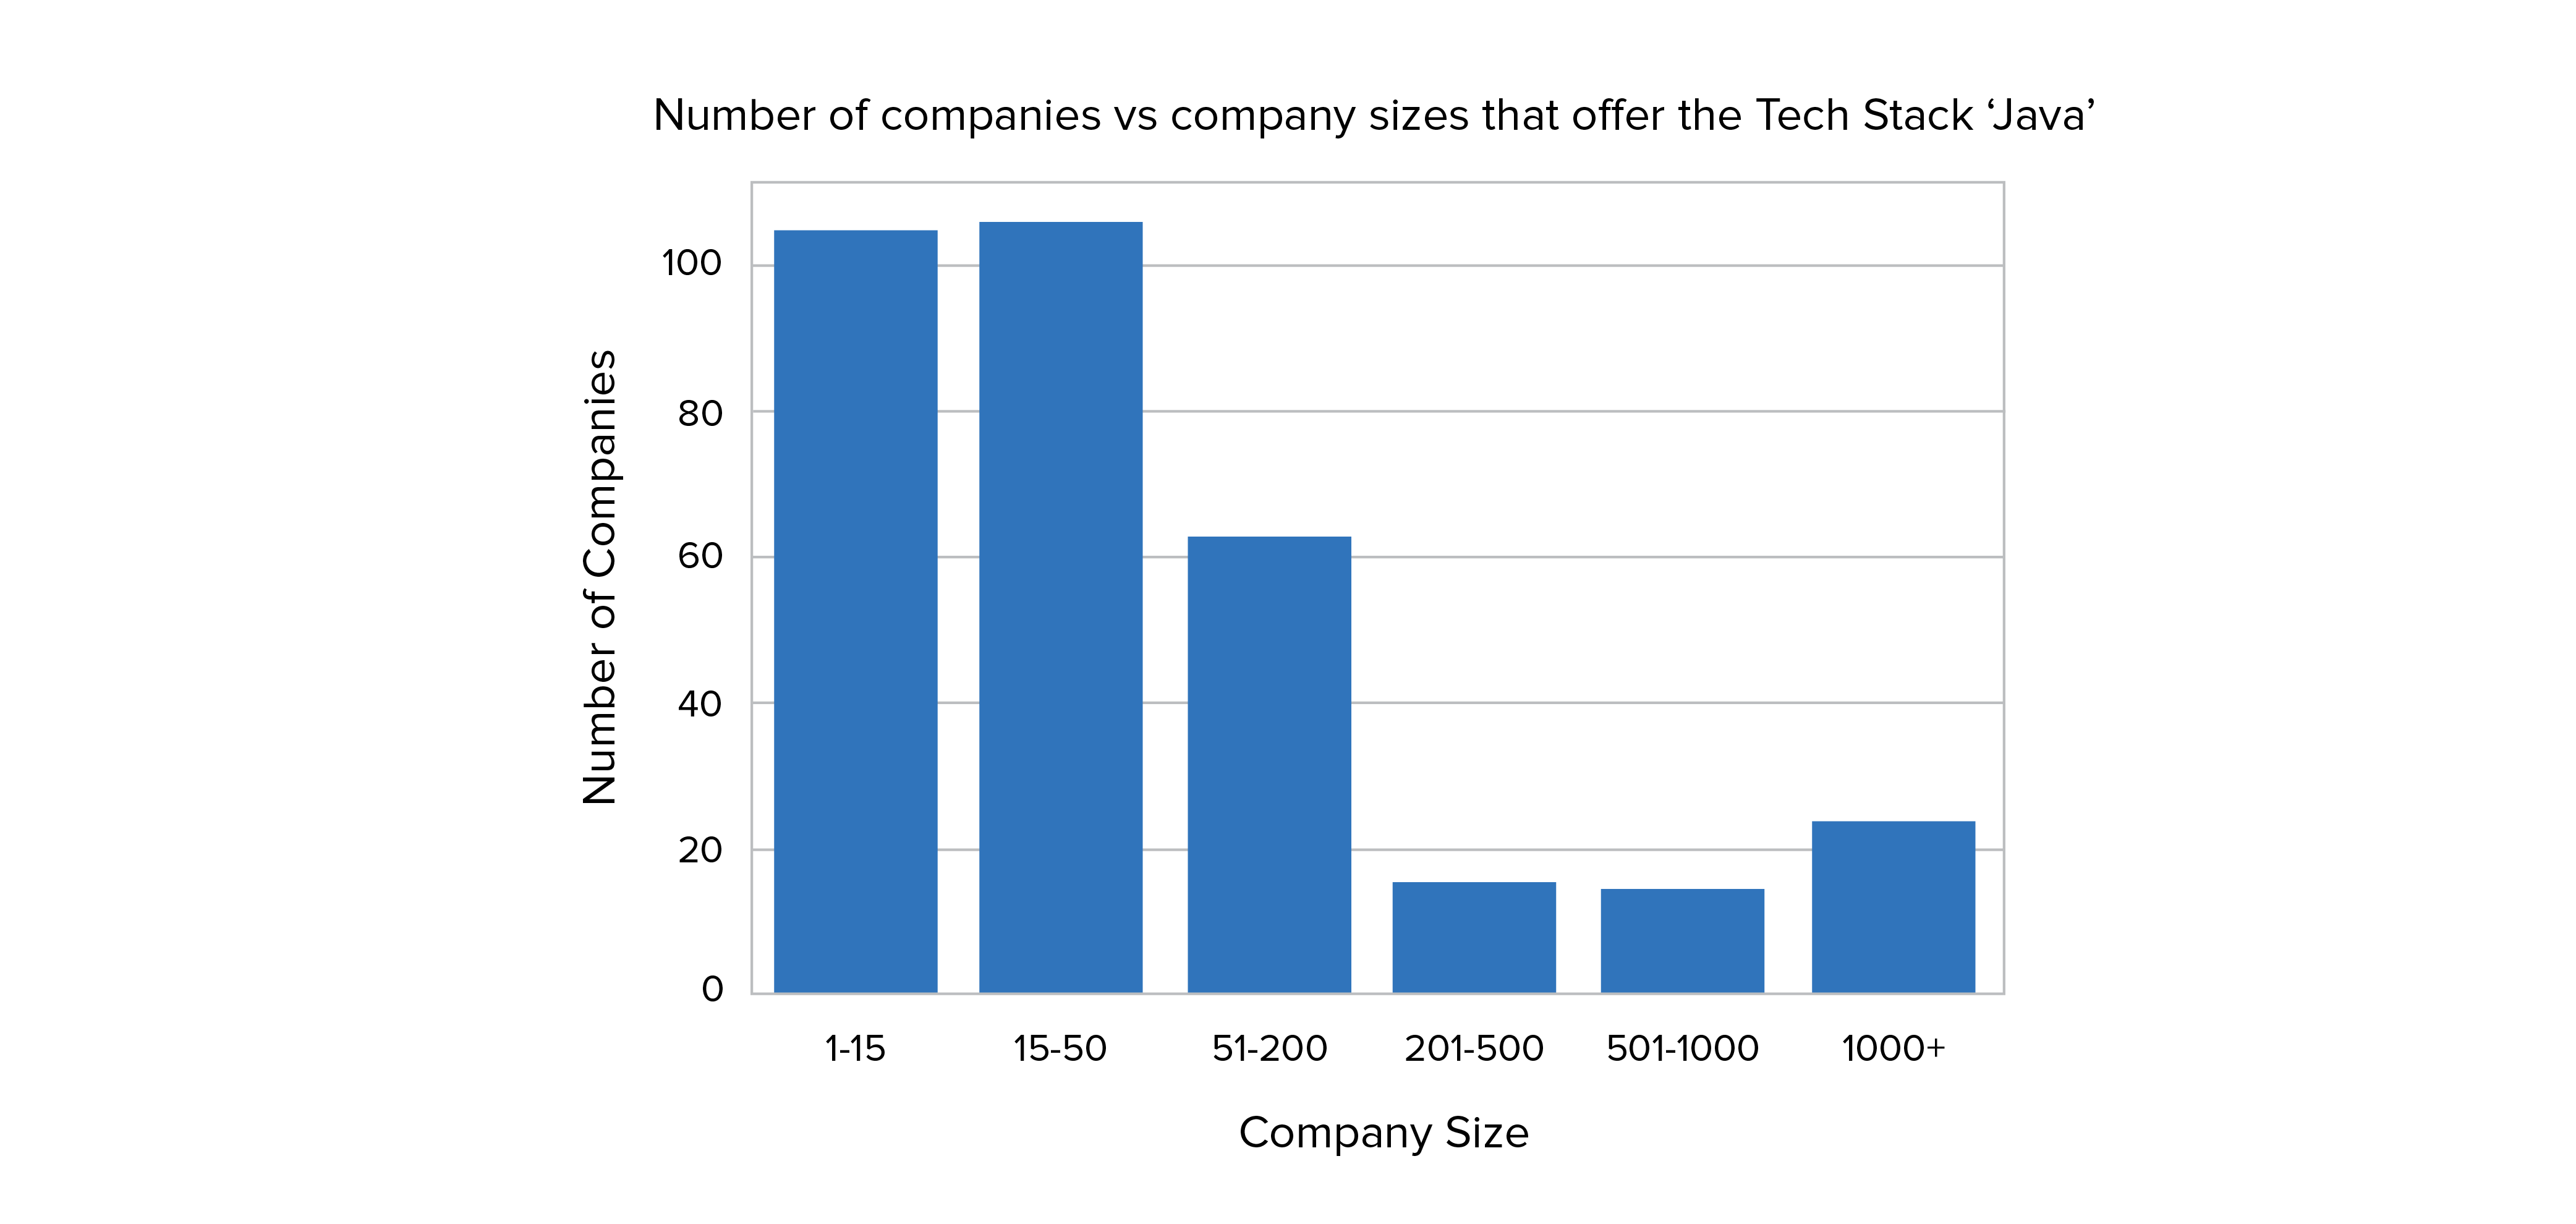
The data for this visualisation was sourced from OfferZen's public data set. This public data set was processed and the visualisation above is part of my previous post that I published with OfferZen.
This time, we will only be using the underlying chart data that produced this visualisation. We do this so that, as I mentioned before, we can focus on what it takes to build a visualisation and not have to worry about the retrieval of data.
Add a Value Object
We start by adding a value object to represent the graph data. This value object consists of the X-axis and Y-axis labels as properties.
class CompanySizeVsNumberOfCompanies {
 final String companySize;
 final int numberOfCompanies;

 CompanySizeVsNumberOfCompanies(this.companySize, this.numberOfCompanies);
}
Transform the Value Object into a Chart Series
Our charting framework requires us to transform our processed data into a ChartSeries Object so that the chart renderer can display the data properly. In the code snippet below, the data object is the actual data that we will use for our data visualisation. What we want to return is a chart series representation of our data points:
static List<charts.Series<CompanySizeVsNumberOfCompanies, String>>
   _createVisualizationData() {
 // ADD SOME DEFAULT DATA HERE
 final data = [
   CompanySizeVsNumberOfCompanies("1-15", 10),
   CompanySizeVsNumberOfCompanies("15-50", 20),
   CompanySizeVsNumberOfCompanies("51-200", 30),
   CompanySizeVsNumberOfCompanies("201-500", 10),
   CompanySizeVsNumberOfCompanies("501-1000", 40),
   CompanySizeVsNumberOfCompanies("1000+", 50),
 ];

 return [
   charts.Series<CompanySizeVsNumberOfCompanies, String>(
       id: 'CompanySizeVsNumberOfCompanies',
       colorFn: (_, __) => charts.MaterialPalette.blue.shadeDefault, //USE A MATERIAL BLUE COLOR SCHEME
       domainFn: (CompanySizeVsNumberOfCompanies dataPoint, _) => // WHICH X AXIS VALUE DO WE USE?
           dataPoint.companySize,
       measureFn: (CompanySizeVsNumberOfCompanies dataPoint, _) => // WHICH Y AXIS VALUE DO WE USE?
           dataPoint.numberOfCompanies,
       data: data) // WHICH DATA DO WE USE?
 ];
}
Create and Configure the Chart Widget
The last step is to create and configure the chart widget. This allows us to actually see the chart on our mobile device:
class Visualization extends StatelessWidget {
 @override
 Widget build(BuildContext context) {
   {
     return Scaffold(
       appBar: AppBar(
         title: Text('Offerzen App'),
         centerTitle: true,
       ),
       body: Center(
         child: Column(
           mainAxisAlignment: MainAxisAlignment.center,
           children: <Widget>[
             SizedBox(
               height: 250,
               child:
                   charts.BarChart(
                       _createVisualizationData(),
                       animate: true,
                       behaviors: [
                         charts.ChartTitle('Company Size vs Number of Companies'),
                         charts.ChartTitle('Number of Companies',
                             behaviorPosition: charts.BehaviorPosition.start),
                        charts.ChartTitle('Company Size',
                             behaviorPosition: charts.BehaviorPosition.bottom)
                       ],
                       ),
             )
           ],
         ),
       ),
     );
   }
 }
Code Snippet Notes
- A
Scaffoldis a convenience class given by Flutter to build a barebones skeleton application without the need for any code generation. - Take note of how everything is a widget, so the programming style is widget-oriented and follows a hierarchy. So, in our example, we go from Center (Alignment) -> Column (Placement) -> SizedBox (Constraint) -> BarChart (Actual Visible Widget)
Tip: Flutter is a widget-based framework, meaning that there is a root widget with a hierarchy of other widgets. So, every object that is rendered on screen is a widget. This includes things that you can see, like buttons and text, as well as things that you cannot easily see, like layouts and scrolling.
Flutter also comes with a full set of first party widgets. The default widget set that is in the SDK allows you to build many data applications with relative ease.
Once you've added the chart widget and run it, you should see an application that looks like this:
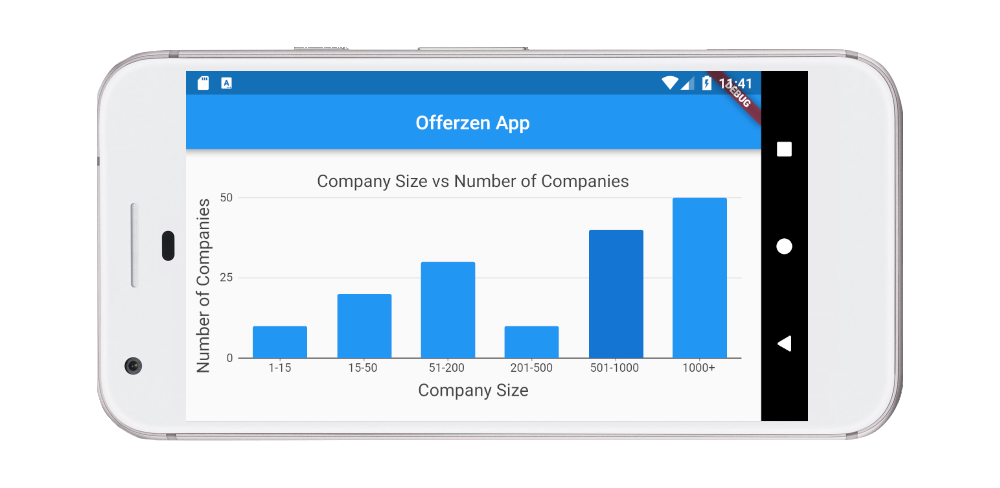
This is only the start and there is still so much more to explore with Flutter and mobile data visualisations. I would love to see the apps that you make with Flutter. Share them with me, and with the world!
Full Source
main.dart
import 'package:charts_flutter/flutter.dart' as charts;
import 'package:flutter/material.dart';

//Main method for all Flutter Applications
void main() => runApp(MyApp());

/**
* This class is the root Widget of the application. It will be composed
* of other widgets.
*/
class MyApp extends StatelessWidget {
 // This widget is the root of your application.
 @override
 Widget build(BuildContext context) {
   return MaterialApp(
     title: 'Flutter Demo',
     theme: ThemeData(
       primarySwatch: Colors.blue,
     ),
     home: Visualization(),
   );
 }
}

/**
* This is a visualization widget that will build our visualization
*/
class Visualization extends StatelessWidget {
 @override
 Widget build(BuildContext context) {
   {
     return Scaffold(
       appBar: AppBar(
         title: Text('Offerzen App'),
         centerTitle: true,
       ),
       body: Center(
         child: Column(
           mainAxisAlignment: MainAxisAlignment.center,
           children: <Widget>[
             SizedBox(
               height: 250,
               child:
                   charts.BarChart(
                       _createVisualizationData(),
                       animate: true,
                       behaviors: [
                         charts.ChartTitle('Company Size vs Number of Companies'),
                         charts.ChartTitle('Number of Companies',
                             behaviorPosition: charts.BehaviorPosition.start),
                        charts.ChartTitle('Company Size',
                             behaviorPosition: charts.BehaviorPosition.bottom)
                       ],
                       ),
             )
           ],
         ),
       ),
     );
   }
 }

 static List<charts.Series<CompanySizeVsNumberOfCompanies, String>>
     _createVisualizationData() {
   final data = [
     CompanySizeVsNumberOfCompanies("1-15", 10),
     CompanySizeVsNumberOfCompanies("15-50", 20),
     CompanySizeVsNumberOfCompanies("51-200", 30),
     CompanySizeVsNumberOfCompanies("201-500", 10),
     CompanySizeVsNumberOfCompanies("501-1000", 40),
     CompanySizeVsNumberOfCompanies("1000+", 50),
   ];

   return [
     charts.Series<CompanySizeVsNumberOfCompanies, String>(
         id: 'CompanySizeVsNumberOfCompanies',
         colorFn: (_, __) => charts.MaterialPalette.blue.shadeDefault,
         domainFn: (CompanySizeVsNumberOfCompanies dataPoint, _) =>
             dataPoint.companySize,
         measureFn: (CompanySizeVsNumberOfCompanies dataPoint, _) =>
             dataPoint.numberOfCompanies,
         data: data)
   ];
 }
}

class CompanySizeVsNumberOfCompanies {
 final String companySize;
 final int numberOfCompanies;

 CompanySizeVsNumberOfCompanies(this.companySize, this.numberOfCompanies);
}
Shiraaz Moollatjie is a Technical Architect at CSG International and an avid data visualisation enthusiast. He likes exploring technologies and tinkering with them. He appreciates decent memes from time to time.