Software developers are in high demand across the world. The acceleration of existing tech trends – especially remote work, eCommerce, and digitisation – means that developers have more global opportunities than ever before. With great demand comes a great salary potential, but what does that actually look like? In this article, we'll explore average developer salaries in the tech hubs of Cape Town, Johannesburg, Amsterdam, Paris, and Berlin and the standard of living that these salaries afford them.

Silicon Valley no longer has the monopoly on global tech innovation
Europe’s tech industry has grown considerably in the past few years: Its tech ecosystem has expanded to almost $1 trillion in combined value and already produced 27 billion-dollar businesses in the first three months of 2021! Amsterdam, Berlin, and Paris are three hubs driving Europe’s tech growth.
Amsterdam is the capital and most populous city in the Netherlands. It also has the largest share of the country’s tech startups. Berlin and Paris are ranked as the second and third biggest European tech hubs respectively.
Tech’s rapid growth extends beyond Europe: South Africa is Africa’s tech powerhouse, and is starting to gain traction internationally. Cape Town — one of the country’s three capital cities — is the continent’s tech capital and the new home of Amazon’s African headquarters. Johannesburg is the country’s most populous city and its second-largest tech hub.
Tech’s global reach, and the recent shift to remote, gives developers the opportunity to work in any tech hub of their choice. In our recent State of the Netherlands’ Software Developer Nation Report, surveyed developers listed a better salary offer as their second most common reason for leaving a job after poor management. But what exactly is a better salary?
It’s tempting to think that a higher salary means a better salary, but it’s not that simple. Let’s explore what developers earn in each of these hubs and the standard of living that this affords them.
Berlin takes the top spot for pre-tax developer salaries
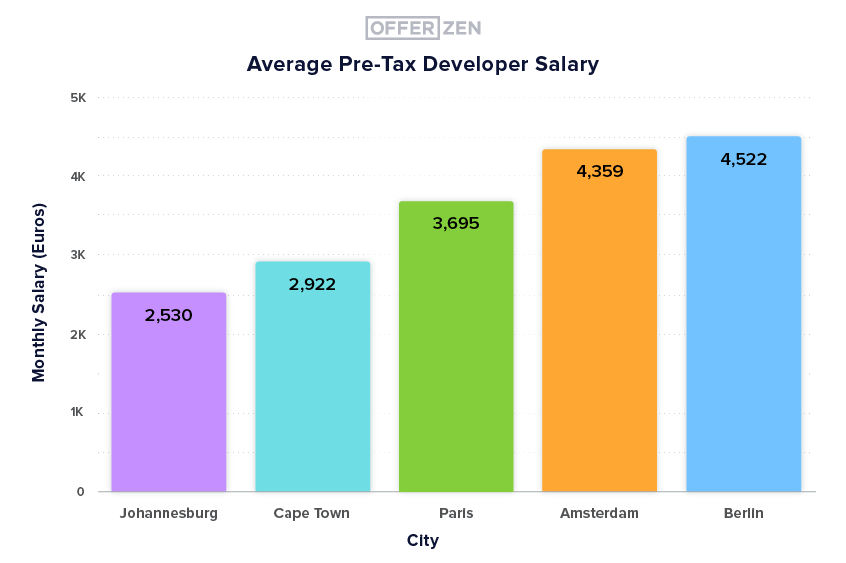
Based on pre-tax salaries only, it looks like Berlin is the place to be for developers: Berlin developers earn the highest average pre-tax salary at €4 522 (R76 688) per month. This is roughly 4% higher than Amsterdam in second, 55% higher than Cape Town, and a massive 79% higher than Johannesburg.
Right now, this appears to paint a pretty bleak picture for our South African developer community, but:
Focusing on pre-tax salary doesn’t tell the whole story. Your post-tax salary is a better guide to what you can expect to take home each month.
Amsterdam is a developer’s place to be for post-tax salaries
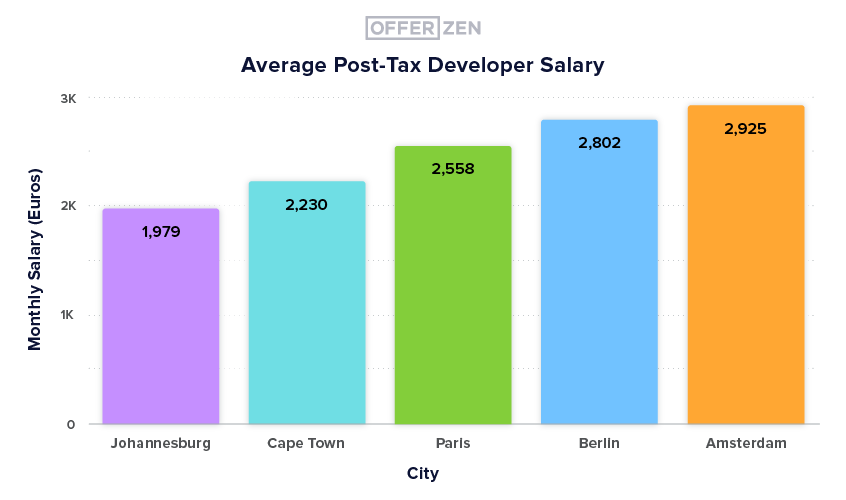
Once we run the pre-tax salaries through local tax calculators, you get a more realistic idea of what you can expect to take home each month. This changes the picture slightly:
Amsterdam takes the top spot from Berlin. Developers in Amsterdam take home a monthly salary of €2 925 (R48 608) on average: 4% more than those in Berlin, 14% more than Parisians, and 31% more than Capetonians.
Johannesburg remains in last place with an average post-tax salary that’s 48% lower than Amsterdam’s but:
Developers in South Africa lose the least of their salary to the taxman.
While Parisian developers have the lowest average post-tax salaries in Europe, they’ve experienced the largest average salary increase between 2019 and 2021.
Developer salaries in Paris have increased the most
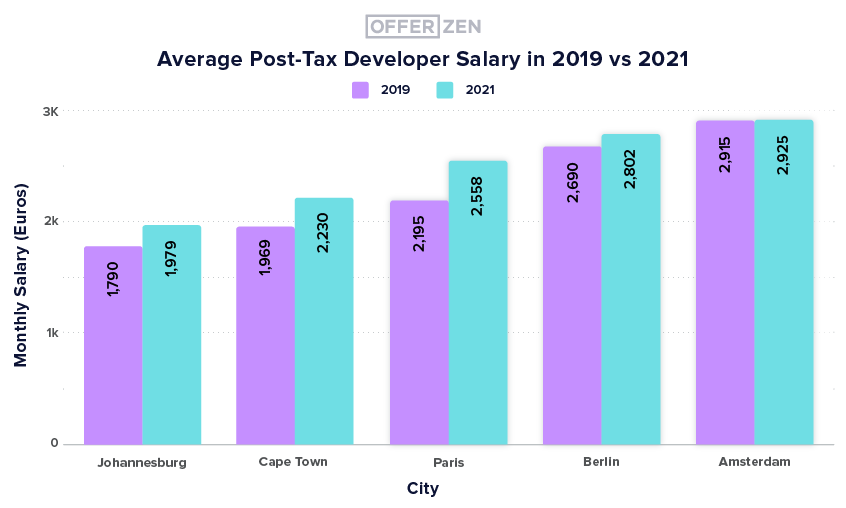
We compared changes in developer salaries between 2019 and 2021. Let’s start with the good news:
Average post-tax salaries increased across all cities between 2019 and 2021.
In detail, however, there are quite big differences across locations: Capetonian developers saw a 13% or €261 (R4 427) pay rise between 2019 and 2021. Average developer salaries in Johannesburg increased by 11% or an additional €189 (R3 205).
Parisian developers benefited from the largest overall increase at 17% or €363 (R6 156). Developers in Berlin saw a 3% or €111 (R1 882) pay rise.
Developers in Amsterdam, however, on average only saw a meagre 0.34% increase over three years. This means an extra €10 (R196) each month – or two beers at the local pub!
While Parisian developers have seen the largest average salary increase, developers in South Africa have a significant factor in their favour: A lower cost of living.
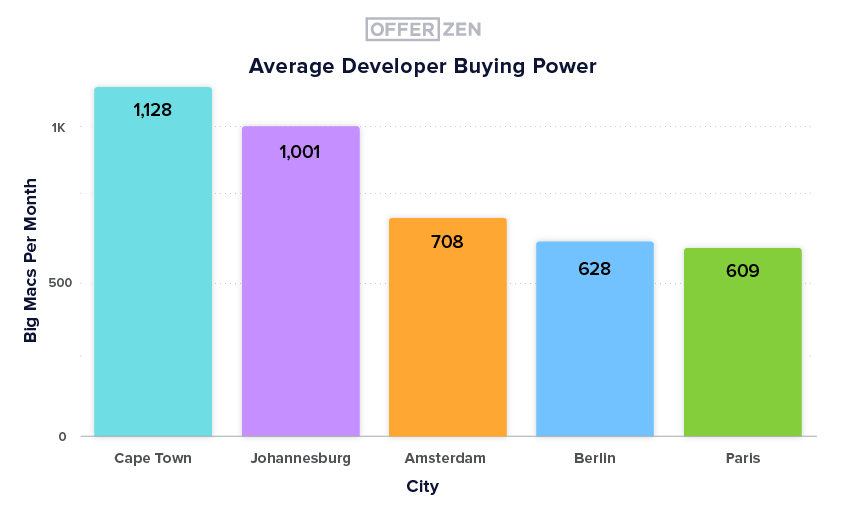
Developers in Cape Town have the highest buying power
Amsterdam developers earn the highest average post-tax salary of €2 925 (R48 608) and Parisian developers saw the largest salary increase at 17%. But do they really have it best?
We’ve used the Big Mac Index to give you a clearer picture of the standard of living you can expect with each city’s average post-tax salary.
Amsterdam represents the best value for money in Europe: The average developer in Amsterdam can buy 708 Big Macs each month compared to Berliners’ 628. This means that developers in Amsterdam have 13% more buying power than those in the German capital.
Paris represents the worst value for money overall: Parisian developers find themselves in last place with 609 Big Macs each month or about 14% less buying power than those in Amsterdam, and 3% less than those in Berlin.
If you’re looking to make the most of your hard-earned money, Cape Town offers a bargain:
The average Capetonian developer can buy a whopping 1 128 Big Macs each month! This gives developers in the city approximately 59% more buying power than developers in Amsterdam.
In summary
It’s important to do your homework when you evaluate a job offer: As we’ve seen, a pre-tax salary isn’t the best indicator of your take-home pay and the quality of living you can expect. Our advice is to research the tax rate in that region and identify any other standard deductions you’ll have to make. It’s worth keeping in mind that a higher salary and a low tax rate don’t necessarily mean you’ll have more disposable income.
It’s also always important to keep in mind that every individual’s context is different. Compensation is a personal conversation that should take place between employee and employer and take into consideration the nature of work, perks, and other contextual factors like tech stack or industry.
Keep in mind
There are thousands of factors that influence developer salaries ranging from company size to tech stack. For the purposes of this article, we’ve only considered average developer salaries in each city. These are averages for all developers and seniority levels. They are used to illustrate how factors like tax and cost of living influence developer salaries in different countries. They shouldn’t be used to estimate what your salary will or should be.
South African salary amounts are based on data provided by more than 3500 respondents in OfferZen’s 2021 State of South Africa’s Software Developer Nation Report. European salary averages are taken from Payscale.com. All 2021 salary figures are based on the latest available data for the year. We’ve used a €1 to R16.96 exchange rate for our currency conversions shown in this article.
We’ve used local tax calculators to give you a rough estimate of what you can expect to take home in each city. For South Africa, we’ve used Old Mutual’s tax calculator. We’ve excluded pension contributions from our calculation.
Post-tax salaries for Amsterdam were calculated using the Dutch Income Tax calculator and include holiday allowances and social security contributions. We’ve excluded deductions allowed under the 30% ruling which enables highly skilled immigrants to the Netherlands to claim 30% of their gross salary as a tax-free allowance.
Post-tax salaries for Berlin were calculated using Brutto Netto Rechner’s tax calculator on the assumption that you’re unmarried, child-free, and do not pay church tax. Amounts for Paris were determined using the Salaryaftertax.com calculator.
We compared the cost of living in each city using Numbeo.com. The results showed that Paris was the most expensive city for cost of living, followed by Amsterdam, Berlin, Johannesburg, and Cape Town.
To make the impact of this more easily accessible, we translated this picture into the Big Mac Index, because it gives you a better idea of your respective buying power. The Big Mac Index is a cost of living index that compares the price of Big Macs in different countries. To calculate the number of Big Macs developers in each city can afford, we divided the average developer post-tax salary by the local cost of a burger using the Economist’s Big Mac Data.
If you have any questions or suggestions for a future analysis, feel free to leave a comment below. Make sure you’re subscribed to our newsletter for more articles like this one.
Related resources: