Story points are ubiquitous in the Agile world. If you ask two different Agile teams what they are, however, you'll likely get different answers. Some say it represents complexity or effort. Others say it represents a combination of qualities. And so on.
Here I'll share why I define story points as ideal days and how this helps me with Agile estimation.
The confusion around story points
Story points estimate the effort or complexity required to complete a user story. It's an alternative to traditional time estimates.
It's popular in Agile because many software teams find it easier to estimate in effort than time. The idea is simple: You give a story a point (typically a number) representing its effort. The bigger the effort, the bigger the point.
I've worked with multiple teams that used various kinds of story points. Initially, I was not too fond of it because we didn't have a consensus on how to convert those points to time. Some developers even felt that we didn't need to do this. Having fuzzy estimates that couldn't answer how long stories would take to implement felt silly to me.
For example, in one team, we used a Fibonacci sequence to standardise our points: 1, 2, 3, 5, 8, 13, etc. While this created consistency in the difference between points (aside from 2, each number is about 60% larger than its antecedent one), the numbering still felt arbitrary.
In another team, we used T-shirt sizes (S, M, L, etc.) to represent the effort or complexity of our stories. There was a case where another team I was in used a variant of T-shirt sizes, but in such a way that there was no objective proportionality to each other nor consensus on what each size represented. This complicated our iteration planning and backlog refinement sessions.
I didn't believe story points were supposed to be so difficult. As a result, I went down a rabbit hole to find out what it ought to be straight from the horse's mouth. That was when I discovered a living legend who’s done software for over 50 years: Ron Jeffries.
Going back to the old school story points definition
Ron Jeffries — one of the 17 authors of the Agile Manifesto — created story points. First used in Extreme Programming (XP), the original definition of a story point was one ideal day.
An ideal day represents the ideal circumstances for development. A day without meetings other than the daily standup. A day without distractions. Serenity.
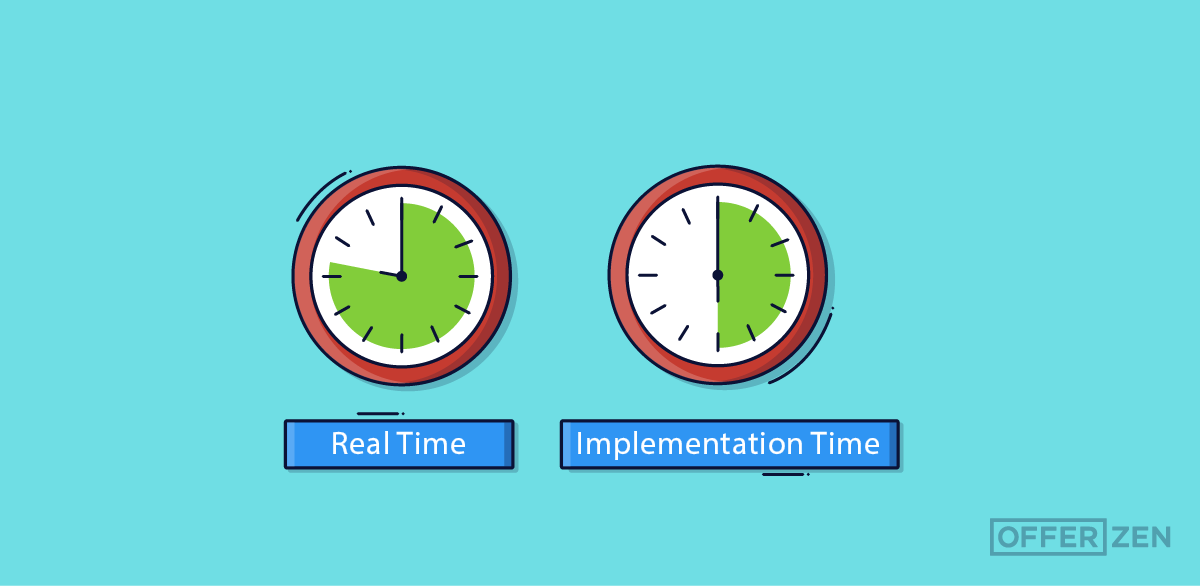
Technically, an ideal day consists of about 8 hours of 'implementation' time, as Ron Jeffries calls it. Think of implementation time as when you're actively working on a story in your 'assembly line'. That's when you're actively developing, testing, integrating, or deploying the story's code.
Note that this is not the same as elapsed or cycle time. Cycle time is the total time it takes to complete a story from when you started working on it. Think of it as the time from when it moves into the 'Doing' column to when it moves into the 'Done' one of your Kanban board.
For example, if you spend an hour a day implementing a story for eight days, its implementation time would be eight hours - or one ideal day - and its elapsed/cycle time would be eight days.
The benefits of using ideal days as story points
Having worked in teams defining story points as the old school 'ideal days', I've experienced this definition being more effective than the other kinds of story points we used before. Because it has an objective description that’s easy to understand and it’s easy to convert to traditional estimates.
Faster estimates with ideal days
Ideal day story points have enabled my peers and I to estimate our user stories faster because we don't have to consider cycle-time concerns. For example, we don't have to think about how much time we'll have outside of meetings, responsibilities outside our projects, or when our team members will be on leave. We just imagine how long it will take to implement in ideal days. As a result, our backlog refinement sessions are more productive.
Easy to convert ideal days to traditional estimates
Ideal day story points allow us to convert our story points to traditional estimates based on the solid data produced by our iterations. By having traditional estimates, such as the number of actual days it will take us to complete a story, we are able to effectively communicate with our stakeholders and express the work time in terms they are familiar with.
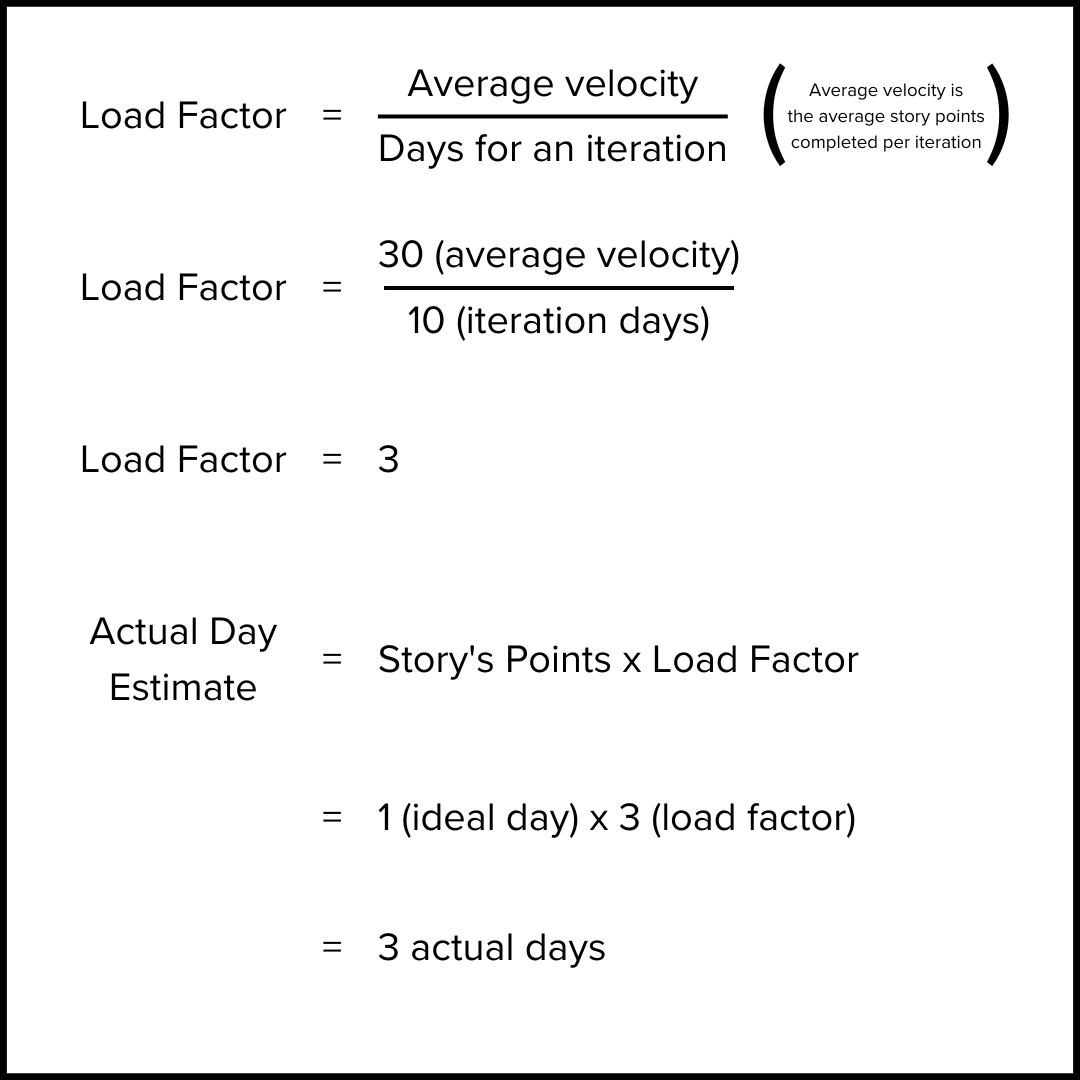
We can convert our points to traditional estimates using our average velocity, where velocity is the average number of story points completed per iteration. To get our load factor, we divide our velocity by the days in the iteration. For example, if our average velocity is 30 points and we work in two-week iterations, the ratio will be 3 (30 points / 10 iteration days).
To know how long a story will take in actual days (cycle time), we multiply its points by the calculated load factor. A 1-point story will therefore take about three actual days.
Ideal days allow us to calculate our flow efficiency
With ideal days, we can measure our Kanban board's flow efficiency with a fair degree of accuracy. Flow efficiency is the ratio of implementation time to cycle time. Because we use ideal days, our average velocity reflects our team's average implementation time per iteration.
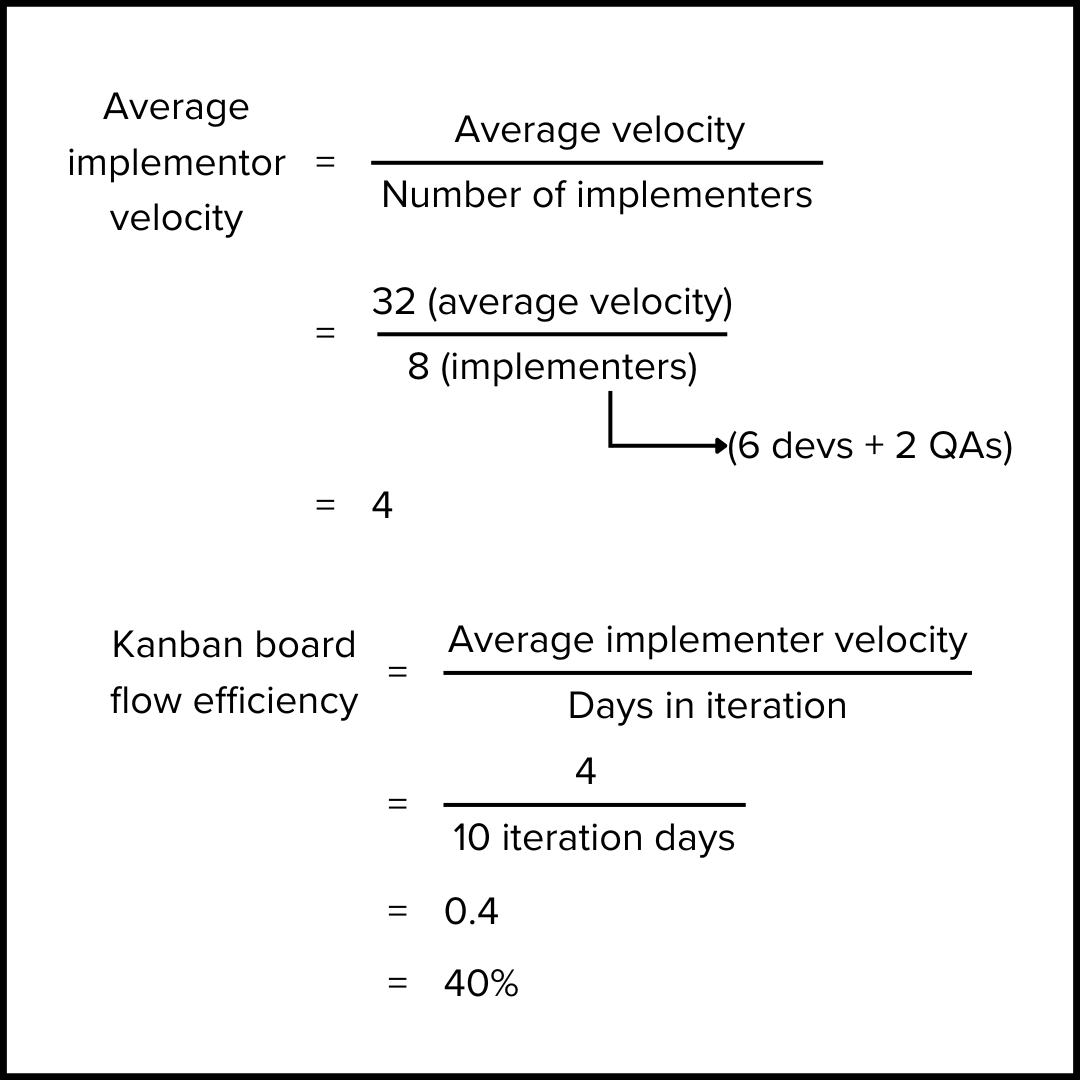
We can calculate our flow efficiency as the average velocity per implementer to the days in the iteration. To get the average velocity per implementer, we divide our velocity by the number of implementers (developers and QAs).
For example, if our velocity is 32 points and we have six devs and two QAs, the average velocity per implementer would be 4 (32 points / 8 implementers). Now we can apply the efficiency formula. The flow efficiency would be 0.4 or 40% (4 ideal days per implementer / 10 iteration days). Leadership can now ask why implementers can only spend about 40% of their days implementing (on the assembly line).
In retrospect, I remember a project where excess meetings were one of the main reasons for such low efficiency. I wish I had ideal day story points to do this calculation back then. That would've shifted some pressure away from us implementers to those who bogged us down in superfluous meetings.
Conclusion
I love estimating with ideal day story points. It's easy to understand. Quick to estimate with. You can convert it to traditional estimates. And you can use it to measure your workflow efficiency. How's that for a reason to go old school on story points?
Christiaan Fouché is passionate about enabling teams to produce a continuous flow of features. His repertoire includes Clean Code, Clean Architecture, Agile, DevOps, and technical leadership.
Read more
- How Agile Has Empowered Me as a Developer
- 6-Step Process for Optimal Planning in Agile Teams
- Mob Programming Memoirs: Agile Collaboration On Steroids!