Automating a geyser switch to save electricity shouldn't be hard, but what is the best timing? Here's how I used MongoDB's Timeseries Collection and Atlas Data API to track long-term data and find the optimal times to switch my geyser on and off.

For years my mom has been manually switching the two geysers on and off at our family home in an attempt to reduce our electricity consumption. With the rise in popularity of smart switches and me being a tinkerer and automator at heart, I thought there'd be a much better solution to this problem.
Turns out, there is: Sonoff smart switches! These little devices are controlled over wifi using an Espressif ESP8266 system-on-chip (SoC), which is one of the most widely used hobbyist controllers.
To automate switching my geyser on and off using smart Sonoff switches, I first needed to track long-term data to find the optimal time to switch the geyser on and off. Here’s how I created a proof of concept, long-term data tracking tool using MongoDB’s Data API and Timeseries collection features.
Home automation hardware and software
Sonoff switches are well-supported by ESPHome. ESPHome is a home automation system that enables greater customisation than the default manufacturer firmware on home automation devices allow. It also easily integrates with a number of home automation platforms.
I needed ESPHome, because the default software on the Sonoff devices and associated mobile app doesn't do long-term tracking of data. I needed this data to better understand how turning on and off the geyser at different times impacts electricity usage. Also, it’s just cooler doing it myself!
The first step in this project was to get hold of a relatively inexpensive Sonoff smart switch with power monitoring, and modify it so I could start gathering data.
Before spending time and money on the more expensive switches, I created a proof of concept using the cheaper Sonoff POW R2. The more expensive POW R3 is needed for the high loads on geysers, but I find it’s always better to start small, make mistakes and learn before going big.
Before getting started with my data collection, I had to re-flash the firmware on the Sonoff POW R2. Re-flashing the firmware on the Sonoff device is a little beyond the scope of this article, but you can find out how to set up the POW R2 for firmware flashing here, and how to generate the firmware here.
This was the ESPHome firmware configuration I used:
substitutions:
  device: sw-pow-lounge

esphome:
  name: ${device}
  on_boot:
    then:
      - switch.turn_on: relay

esp8266:
  board: esp01_1m

# Configure logging
logger:
  baud_rate: 0

# Enable Home Assistant API
api:
wifi:
  ssid: <wifi_ssid>
  password: <wifi_password>

uart:
  rx_pin: RX
  baud_rate: 4800

switch:
  - platform: gpio
    name: "Relay"
    id: relay
    pin: GPIO12

sensor:
  - platform: cse7766
    current:
      name: "Current"
      id: current
    voltage:
      name: "Voltage"
      id: voltage
    power:
      name: "Power"
      id: power
    energy:
      name: "Energy"
      id: energy

  - platform: total_daily_energy
    name: "Total Daily Energy"
    id: daily_energy
    power_id: power

http_request:
  id: http_request_data
  useragent: esphome/device
  timeout: 10s

time:
  - platform: sntp
    id: sntp_time
    on_time:
      - seconds: 0
        minutes: /1
        then:
          - http_request.post:
              url: "https://data.mongodb-api.com/app/data-abcde/endpoint/data/beta/action/insertOne"
              headers:
                content-type: "application/json"
                access-control-request-headers: "*"
                api-key: <mongodb_data_api_key>
              verify_ssl: false
              json: |-
                root["dataSource"] = "iot";
                root["database"] = "iot";
                root["collection"] = "sensors";
                root["document"]["ts"]["$date"]["$numberLong"] = to_string(id(sntp_time).utcnow().timestamp * 1000);
                root["document"]["meta"]["sensor"] = "${device}";
                root["document"]["meta"]["type"] = "Sonoff POW R2";
                root["document"]["current"] = id(current).state;
                root["document"]["voltage"] = id(voltage).state;
                root["document"]["power"] = id(power).state;
                root["document"]["energy"] = id(energy).state;
                root["document"]["daily_energy"] = id(daily_energy).state;
                root["document"]["relay"] = id(relay).state;
                root["document"]["uptime"] = id(uptime_sensor).state;
              on_response:
                then:
                  - logger.log:
                      format: "Atlas Data API Response: %s"
                      args: ['id(http_request_data).get_string()']
Note: The smart devices can't validate the ssl certificate, which is why it's set as false. It still sends encrypted data, but doesn't verify.
After configuring the firmware, I moved on to data collection.
Collecting my data
To create my proof of concept, I used MongoDB's new Timeseries collection feature and their beta Atlas Data API. I chose the Timeseries feature because it is specifically designed for data collected over time, and is indexed to make queries faster. The Atlas Data API allowed me to upload the entries directly from the smart switches to the cloud database via HTTPS rather than writing my own server implementation.
I chose to do it this way as this is just a proof of concept project and writing a full server implementation seemed overkill for just one or two devices. In the future, when I have more devices, I’d consider doing batch-insertion of records - sending multiple readings from multiple devices all at once.
I set up the database and Timeseries collection on MongoDB Atlas as follows:
-
I followed instructions part 1 through 5 of the Atlas: Getting Started guide using the cluster and database name “iot” and locating it in AWS’s
af-south-1location, which happens to be my home city, for the lowest latencies. -
Once connected to the cluster via the MongoDB Shell, I created the Timeseries collection using the following command:
db.createCollection( "sensors", { timeseries: { timeField: "ts", metaField: "meta", granularity: "minutes" }, expireAfterSeconds: 5184000 } )
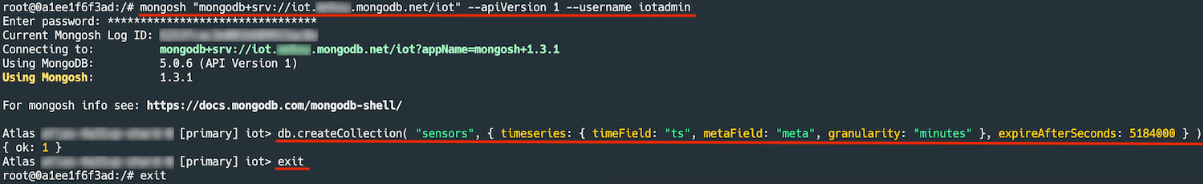
This creates a Timeseries collection optimised for 1 minute intervals that will automatically delete the old data after 5184000 seconds, or 60 days.
The important part to highlight from the ESPHome configuration is this bit that does the upload every minute:
- platform: sntp
    id: sntp_time
    on_time:
      - seconds: 0
        minutes: /1
        then:
          - http_request.post:
              url: "https://data.mongodb-api.com/app/data-abcde/endpoint/data/beta/action/insertOne"
              headers:
                content-type: "application/json"
                access-control-request-headers: "*"
                api-key: <mongodb_data_api_key>
              verify_ssl: false
              json: |-
                root["dataSource"] = "iot";
                root["database"] = "iot";
                root["collection"] = "sensors";
                root["document"]["ts"]["$date"]["$numberLong"] = to_string(id(sntp_time).utcnow().timestamp * 1000);
                root["document"]["meta"]["sensor"] = "${device}";
                root["document"]["meta"]["type"] = "Sonoff POW R2";
                root["document"]["current"] = id(current).state;
                root["document"]["voltage"] = id(voltage).state;
                root["document"]["power"] = id(power).state;
                root["document"]["energy"] = id(energy).state;
                root["document"]["daily_energy"] = id(daily_energy).state;
                root["document"]["relay"] = id(relay).state;
                root["document"]["uptime"] = id(uptime_sensor).state;
              on_response:
                then:
                  - logger.log:
                      format: "Atlas Data API Response: %s"
                      args: ['id(http_request_data).get_string()']
The above snippet allows us to push a single MongoDB document to the Data API endpoint every minute.
This produces a record in the MongoDB Timeseries collection that looks something like this:
{
  ts:"2022-03-15T19:45:00.000+00:00"
  meta: {
    sensor:"sw-pow-lounge"
    type:"Sonoff POW R2"
  }
  current:0.086658
  voltage:241.7052
  power:9.129311
  energy:0.138194
  daily_energy:196.6744
  relay:true
  uptime:50.675
  _id:"6230ecc08d9d161e8cd8a788"
}
With that record, the values from the last minute of data on the device are available to be queried in the database. With the device uploading every minute, it was a matter of waiting for more data to be collected.
Rolling-up the data
After a few days of data streaming in, I wanted to do roll-ups. Rolling-up the data means calculating hourly averages, taking the min or max value within that hour and storing it in another record or table. This is necessary because storing low-interval data for long periods of time isn't efficient. That’s why the Timeseries collection has a 60-day rolling expiry for older data. The further into the future you go, the less important it becomes to see exactly what’s happening - you rather want to see trends over time.
To roll-up the data, I set up this function that runs every hour on the database:
exports = function() {
  const sensors = context.services.get("iot").db("iot").collection("sensors");


  // Setup date range for previous hour
  const now = new Date();
  const start = new Date();
  start.setHours(now.getHours()-1,0,0,0);
  const end = new Date();
  end.setHours(now.getHours(),0,0,0);


  const pipeline = [
    // Match records from the previous hour
    {
      $match: {
        ts: {$gte: start, $lt: end}
      }
    },
    // Group records and calculate rollup data
    {
      $group: {
        _id: {
          date: end,
          sensor: "$meta.sensor"
        },
        current_avg: { $avg: "$current" },
        current_min: { $min: "$current" },
        current_max: { $max: "$current" },
        power_avg: { $avg: "$power" },
        power_min: { $min: "$power" },
        power_max: { $max: "$power" },
        voltage_avg: { $avg: "$voltage" },
        voltage_min: { $min: "$voltage" },
        voltage_max: { $max: "$voltage" }
      }
    },
    // Build new record structure
    {
      $project: {
        _id: 1,
        current: {
          avg: { $round: [ "$current_avg", 5 ] },
          min: { $round: [ "$current_min", 5 ] },
          max: { $round: [ "$current_max", 5 ] }
        },
        power: {
          avg: { $round: [ "$power_avg", 5 ] },
          min: { $round: [ "$power_min", 5 ] },
          max: { $round: [ "$power_max", 5 ] }
        },
        voltage: {
          avg: { $round: [ "$voltage_avg", 5 ] },
          min: { $round: [ "$voltage_min", 5 ] },
          max: { $round: [ "$voltage_max", 5 ] }
        },
      }
    },
    // Write records into rollup collection
    {
      $merge: { into: "sensors_rollup_hourly", whenMatched: "replace" }
    }
  ];


  sensors.aggregate(pipeline).toArray()
  .then(_ => {
    console.log(`Updated aggregate for the period "${start}" to "${end}".`);
  })
  .catch(error => {
    console.error(error);
  });
};
A rolled-up record produced by the above function looks like this:
_id: {
  date:2022-03-16T01:00:00.000+00:00
  sensor:"sw-pow-lounge"
}
current: {
  avg:0.08647
  min:0.08503
  max:0.08853
}
power: {
  avg:9.13232
  min:9.10393
  max:9.15842
}
voltage: {
  avg:243.3155
  min:241.5326
  max:244.2406
}
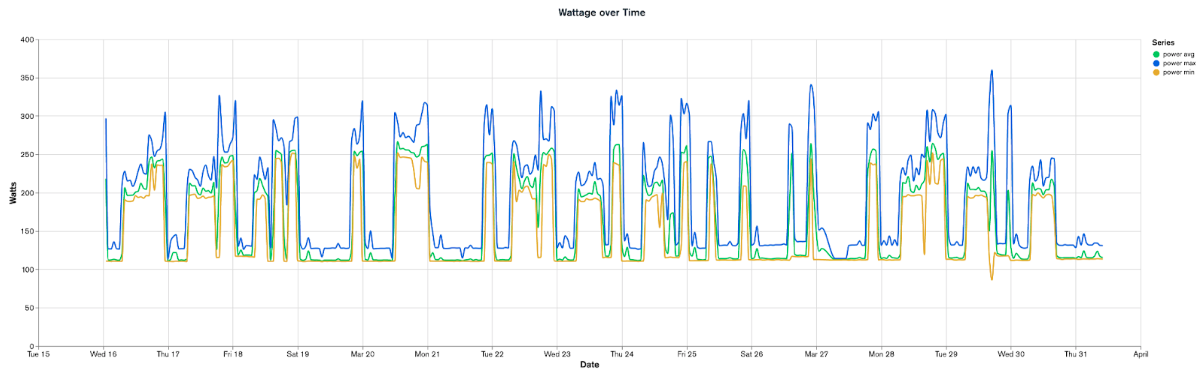
The final piece I wanted to do for this experiment was to visually graph the data to see the usage at a glance. This was easily solved by using another feature that I came across in MongoDB Atlas called Charts. Using Charts to do a basic query of the hourly roll-up data produced the following graph.
Next steps
Having successfully set up these Sonoff devices and after seeing the data in MongoDB and Charts, I’m confident that using the bigger, more expensive Sonoff POW R3 power monitoring switch will allow me to experiment with turning the geyser on and off to find the optimal times for maintaining hot water and saving electricity.
The next step is for me to set up my geyser tracking with the POW R3 switches, and I’ll make sure to update you when I do.
Rob Burger is a born and bred Capetonian. He's a Tech Lead (Platform) at OfferZen, and has also been a teacher, paramedic, support engineer and system/platform architect. He embraces the concept "automate all the things!" to make his and developers' lives easier.
When he's not relishing a good developer experience, you can usually find him in the mountains hiking, running or rescuing. If he's not on a mountain, he's at home tinkering and working on open source projects!