“Estimate: The most optimistic prediction that has a non-zero probability of coming true” — Tom DeMarco
According to the CHAOS manifesto, only 3 out of 10 projects finish on time and on budget, almost half of them fail to complete within the initially set constraints and 2 of them fail miserably in general. While small ones may have a success rate of 70%, only 10% of the big projects succeed. That’s why, according to the authors, IT projects should be broken down into small projects to reduce the scope. But how can you define a good scope?

In this article I will explain some of the basic concepts, formulas and methods that I’ve used for software project estimation in the past. The idea is to understand the complexity of the problem, the resources we need and the effort required to complete it.
Before we start, let’s talk about the most prevalent misconceptions so you can avoid them.
Common Pitfalls
Overestimating time by default
The intrinsic complexity of software projects almost always raises the million dollar question: Should I overestimate or underestimate? According to Hofstadter’s law, “it always takes longer than you expect, even when you take Hofstadter’s Law into account”. So maybe I should overestimate by default? If only it was that easy! Here’s why it’s not:
Work Can Also be Expanded
When the British naval historian Cyril Northcote Parkinson described in 1955 how bureaucracy in an organisation grows over time, he just so happened to hit the nail on the head. Parkinson’s Law states that “work expands so as to fill the time available for its completion".
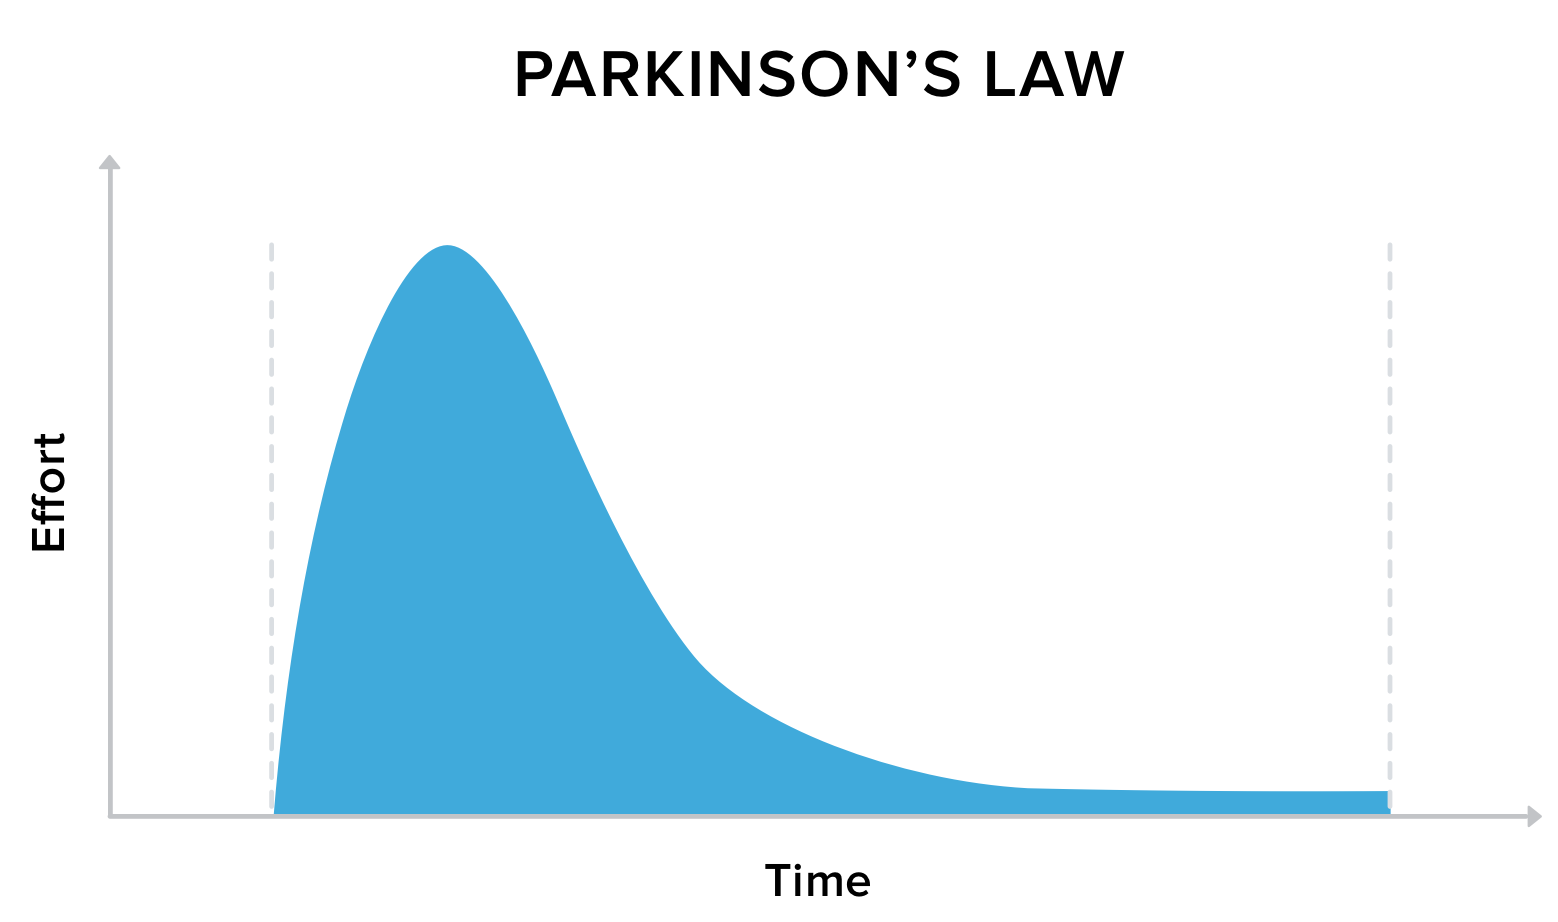
I’ve seen this happen over and over again: If you give the team three months to complete a project, they will spend the entire three months, even if one would’ve been enough. The same goes for budget: If you have x-amount of budget to spend, you are much more likely to actually use all of that money, even if you could have potentially done it with half of the cost.
Depending on which industry you work in, you may be thinking right now: As long as the team completes the project on time and schedule, why not?
LastMinuteDelivery.com
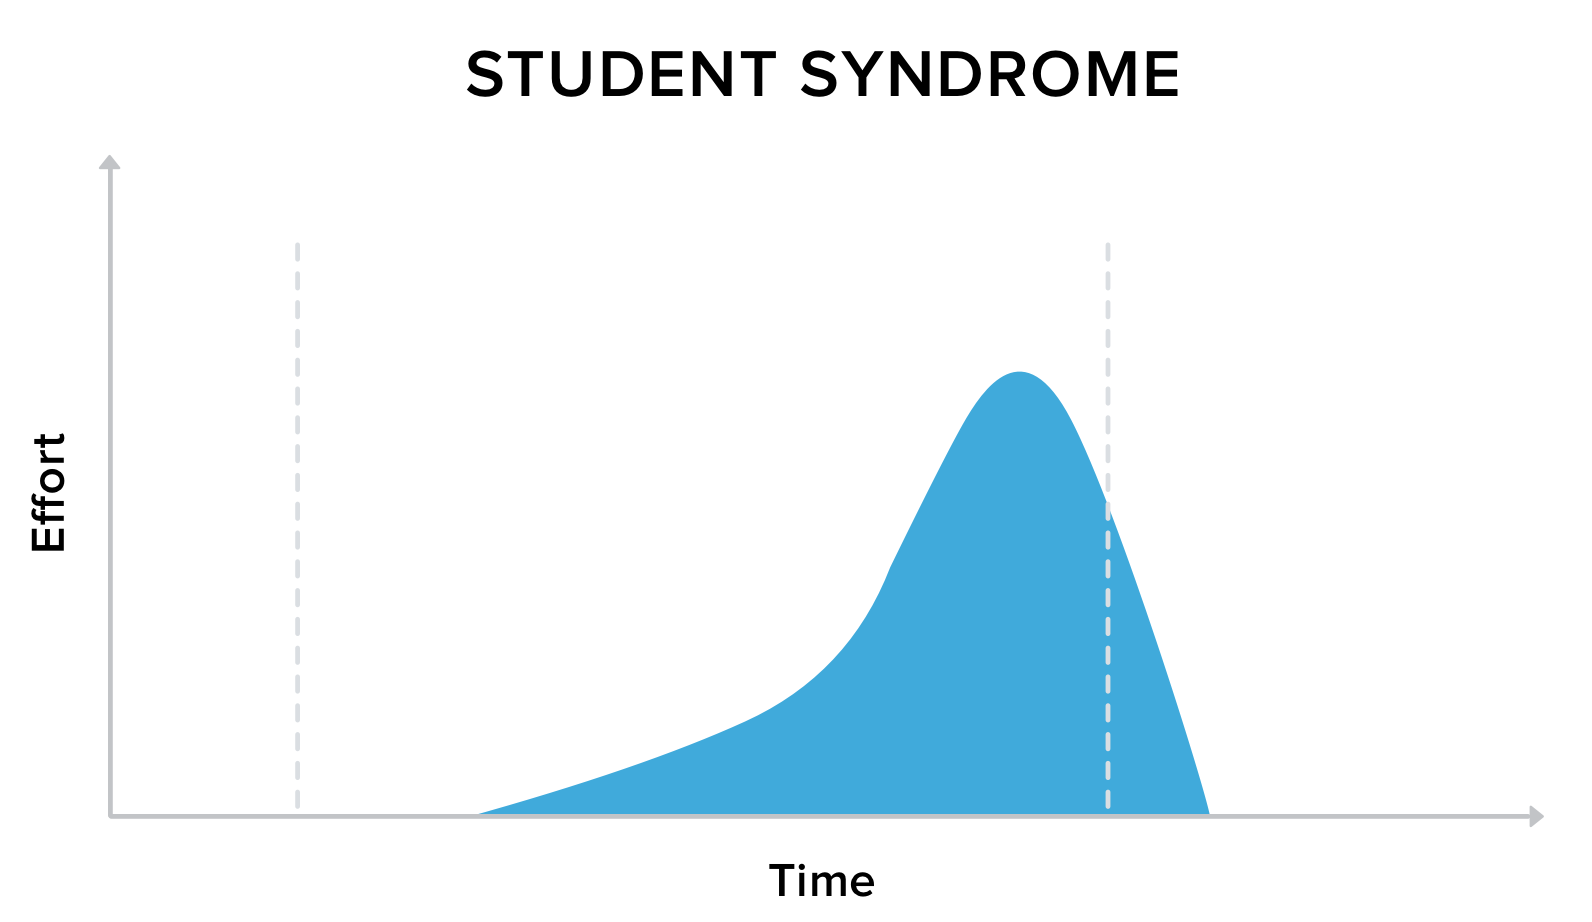
You might know this from yourself - I certainly do and it’s the same for teams: If you give yourself too much time, you will most likely be affected by Student Syndrome, most commonly known as procrastination.
Too much time will result in rushing the work at the very last moment, producing a low quality product and, most of the time, not finishing on schedule.
How to deal with them?
As a professor of mine used to say: “The delivery date is not the target, it’s the limit” - There’s no formula or recipe to completely eradicate the above mentioned phenomenons but having this mindset really helps. Here are some tips:
-
Team empowerment and buffer planning will reduce the risk of unnecessarily stretched out work
-
Daily standups, retrospectives and reviews help the team keep on track and avoid student syndrome
What is a good estimate?
With all this in mind, what makes a good estimate then?
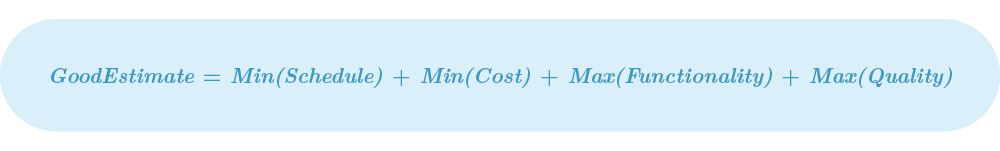
A good software estimation is one that, understanding the reality of the project, proposes the minimum period of time and cost in which we can provide the biggest amount of high quality functionalities.
A while ago, I decided to put my mental processes into mathematical terms. Based on this definition, the equation for a good estimate looks like this:
Let’s look at this in more detail.
Step 1: Define the Scope
Max(Functionality)
First, you have to get a lay of the land. To define your scope or To do list, I recommend to use Agile practices. In my case, I always define User Stories and Features to get an idea of my project’s scope. The idea is to identify the high and mid-level functionalities of the software. However, a classic error is to have only the software in mind. Make sure to identify all the support tasks, meetings, lectures and workshops, - basically you should consider every single task that takes at least five minutes of your team members’ time.
Tip: Always include your team
In any software project your team is everything. Don’t forget to include the stakeholders and invite representatives per relevant department or team during the specification process. If you start the estimation process without your team, you will be biased by your personal opinion, experience and capabilities. You’ll be surprised by the different point of views each person has, depending on their area of expertise. Once you’ve brought everyone together, you can start to...
Step 2: Estimate the Effort
Max(Quality)
Use relative estimates, not hours
Just imagine you have a huge product. How do you know that a developer will take six instead of three hours developing that piece of code? What happens if something goes wrong?
If we use hours, we’re only talking in terms of time, but experienced developers know that that’s just one dimension of a feature. Hours are inadequate when having to take the complexity, uncertainty, volume and knowledge that involve a task into account. In addition, using a time unit risks us falling victim to a neuronal phenomenon called “Temporal Illusion” - everybody experiences, anticipates and estimates time differently. This means that, in the end, any given time unit in an estimation doesn’t really mean anything.
That’s why Agile methodologies embrace the use of relative estimates. That’s not a new concept at all. One of the leading experts in the software estimation and management fields, Lawrence H. Putnam, published his estimation by effort model back in 1978. It’s based on comparison and grouping so that, instead of using an absolute unit like time, you’d define units relative to a concept - in our case effort. In agile, we can define different scales: like t-shirt size, fruit/dog points and, maybe the most popular one, story points.
It’s Effort, Not Complexity
The first thing you need to understand about using effort instead of time units is that effort is not equal to complexity. Complexity is just one dimension of effort.
Effort can be defined as the mix of: knowledge, volume, uncertainty and complexity that compose a certain task. So when you want to define the effort required to complete a User Story/Feature, you assign an effort number.
The most common scale for story points uses a pseudo fibonacci sequence: 0, 1, 2, 3, 5, 8, 13, 20, 40 and 100. There are plenty of arguments for why a nonlinear scale like this works better for estimates - if you are interested, both Alex Yakyma and Mike Cohn have explained this really well.
Estimating with your team - Planning a poker session
Once you have defined all your features, you need to go through them one by one, with the help of your team, and identify their effort. Following Agile techniques, I like to have a Planning Poker session. During this session, each team member has a set of poker cards with your chosen scale and in each turn draw an expected effort value for a specific feature. Estimating every single one of the features, from an agile perspective, would look like an overkill. However, if you want to make a good estimation, trying to understand the complexity of the whole as well as you can is the only way to minimize the risk of underestimating.

That’s why I recommend creating an estimation spreadsheet for every single team member. The sheets need to be separated because if everyone is using the same document you can see other people’s answers and get biased by them. The idea is that each team member makes the quickest estimation possible for every task (ask them to spend no more than 15 seconds per task) individually to later merge the results in one master spreadsheet. Prepare 2-3 meetings no longer than 1 hour for discussion. Each meeting should discuss a feature in less than 1 minute. In some cases, we can use the majority rule, where if six out of eight people said that the size should be x, we can assign that value. I know from my personal experience that by using this strategy, between 5 and 10% of the stories will be removed from the list.
I also recommend to use new technologies for this process. Instead of having meetings, you can always use planning poker software to estimate remotely.
In general terms, try to estimate as much as you can remotely and maybe just leave the critical or most discussed features for a 1 hour in-person meeting.
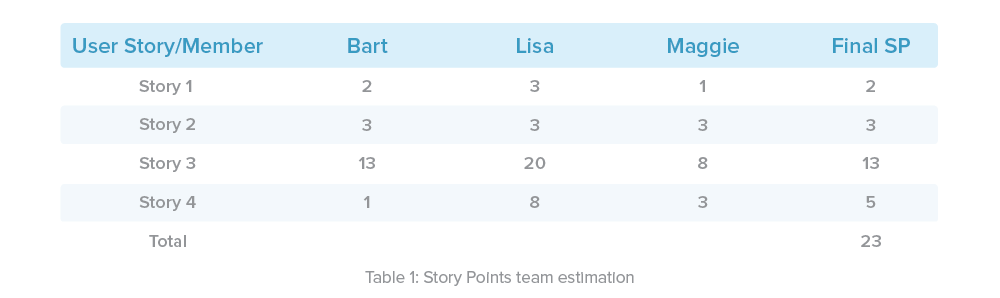
Keep in mind that averages don’t mean anything without dispersion values. Story points require closed values, so discuss the results of your team’s estimates and define a specific number.
To give you an example, this table presents the result of a fictional Planning Poker session:
Defining the expected effort
So far, we have only estimated the optimistic effort of our tasks - a value biased by our experiences and opinions. That’s why we need to calculate a value that tries to minimize this bias error. This value is what we’ll call the expected effort. I will present the effort in terms of story points (SP), but you can use the method of your preference.
One of the most common ways to estimate an expected value is the Program Evaluation and Review Technique (PERT), a simple and powerful method used in project management. It helps to analyze tasks using a weighted average of three parameters: best case, most likely and worst case. We use these averages to calculate the expected effort.
PERT Equation

Let’s assume we estimated our optimistic effort for a specific task with the help of Planning Poker and came out with 8 SP. Let’s imagine the worst case came out as 20 SP and the most likely case as 13 SP (I’ll explain in later sections how to calculate them). The expected effort for that task then comes to this:

It is important to note that PERT is not specifically addressing software estimation, so it doesn’t understand all the variables and problems inherent to software projects. That’s why Richard Stutzke proposes a pessimistic PERT. This equation was designed based on his 40 years of career, so it’s really interesting that these numbers, that may look quite random, have a certain logic that expresses a common phenomenon in software projects. Take a look to the equation:
Stutzke Equation (Pessimistic PERT)

If we assumed the same values from the previous example, our “pessimistic” expected value would now be:

As you can see, Stutzke’s expected effort is lower than the PERT value. Meaning that our team is going to complete less effort during the same period of time. Personally, I always use Stutzke’s equation for real estimated values and PERT to calculate optimistic values. That way, I can show a range of delivery for clients and managers.
Don’t forget to add a buffer
All this planning is absolutely essential, but what happens if some tasks take longer than expected or the effort was much higher than we thought? No estimate will be perfect, and we always need to define a buffer. There are multiple ways, but in my opinion, one of the simplest and most effective methods is the Root Squared Error (RSEM). It helps to compare the total difference between the best and worst cases for all our features showing us how dispersed the values are. This is the RSEM-formula:

Following our example in Table 1, our total effort buffer would look like this:
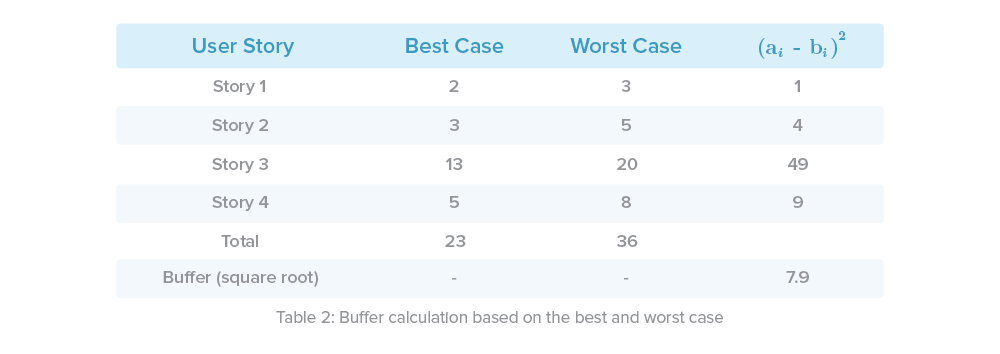
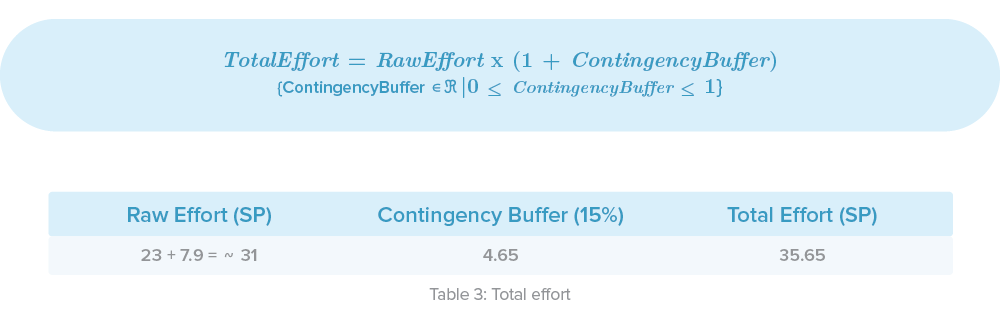
Some authors state that one of the pitfalls of this option is a possible underestimation of the buffer. One way to minimize this risk is to add a contingency buffer that could be defined using a well known probability of risk:

Finally we just need to sum up our optimistic effort (the one that we estimated with our team) and include a contingency buffer. In this case we defined that:
Note: Some people complements this step using the Statistical PERT, where it uses the estimator’s subjective judgement to increase the certainty of our estimate. In that case, you can use the SPERT-7 rule to include your personal opinion/experience.
Also note that I’m not using a PERT estimate yet. That’s because I think that defining the most likely case and worst case for each task in big projects could be an overkill. Assuming those values per task is not easy and finding correlation between historical tasks is a challenge. However, applying PERT to our team’s velocity is easier and it’ll make more sense using historical velocity results.
Step 3: Time Estimation
Min(Schedule)
Calculate the Velocity
In a relative estimate, the velocity is the amount of effort that our team can complete in a specific period of time. If we can identify the velocity of our team, eventually we can calculate the amount of time that we need to complete all the tasks (based on the total effort that we have already calculated).
Personally, I like to use sprints for this. Velocity then determines how many story points our team can complete in a sprint.
If you have historical data, it’s quite easy to figure out this number - just look into your software tools. Otherwise use the following methods:
-
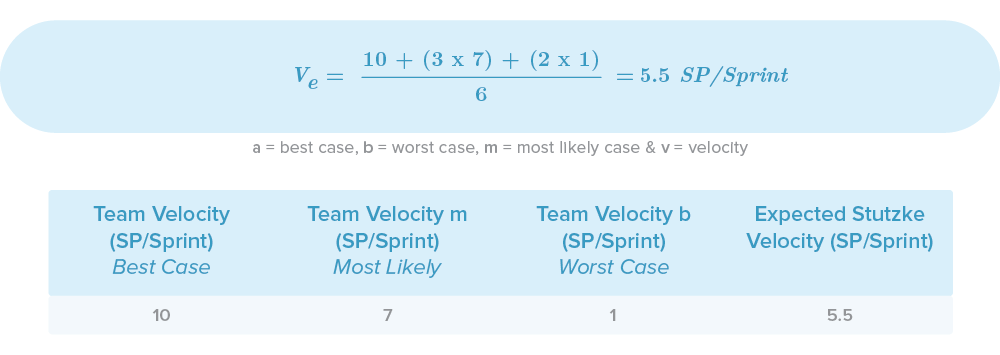
Best case: If your team is new and/or the technologies you’re using are experimental, my recommendation is to have a 5 to 10 minutes long meeting with everyone to define a sprint.
Ask them if they can complete the selected tasks (try not to show the story points) in the defined period of time. Then sum up the story points. That’s going to be your optimistic case. For example, let’s assume that our team defined the best velocity as 10 SP/Sprint
-
Most likely case: According to McConnell, developers generally have a 30% error rate when estimating time needed. Personally, I always use that for our most likely case. Then, our most likely case would be determined by:

- Worst case: Here I recommend using community statistics. According to the CHAOS report’s worst case, for example, we’d only complete 10% of the tasks we promised. Finally, our worst case would be:

Now we just need to calculate the expected Stuzke Velocity:
Knowing you’re on the right path
Now the question could be: Is this result correct? How can we be sure about it? At the end this is just math and it’s not considering all the possible variables that may affect the project (specially the human factors). A good technique is to draw a curve that characterizes the potential velocity for effort completed by our team and use already known distributions, such as normal, beta, triangular or uniform. I personally recommend using the probability density function (PDF) to plot your PERT distribution. Let’s see how it would look using the example values from above:
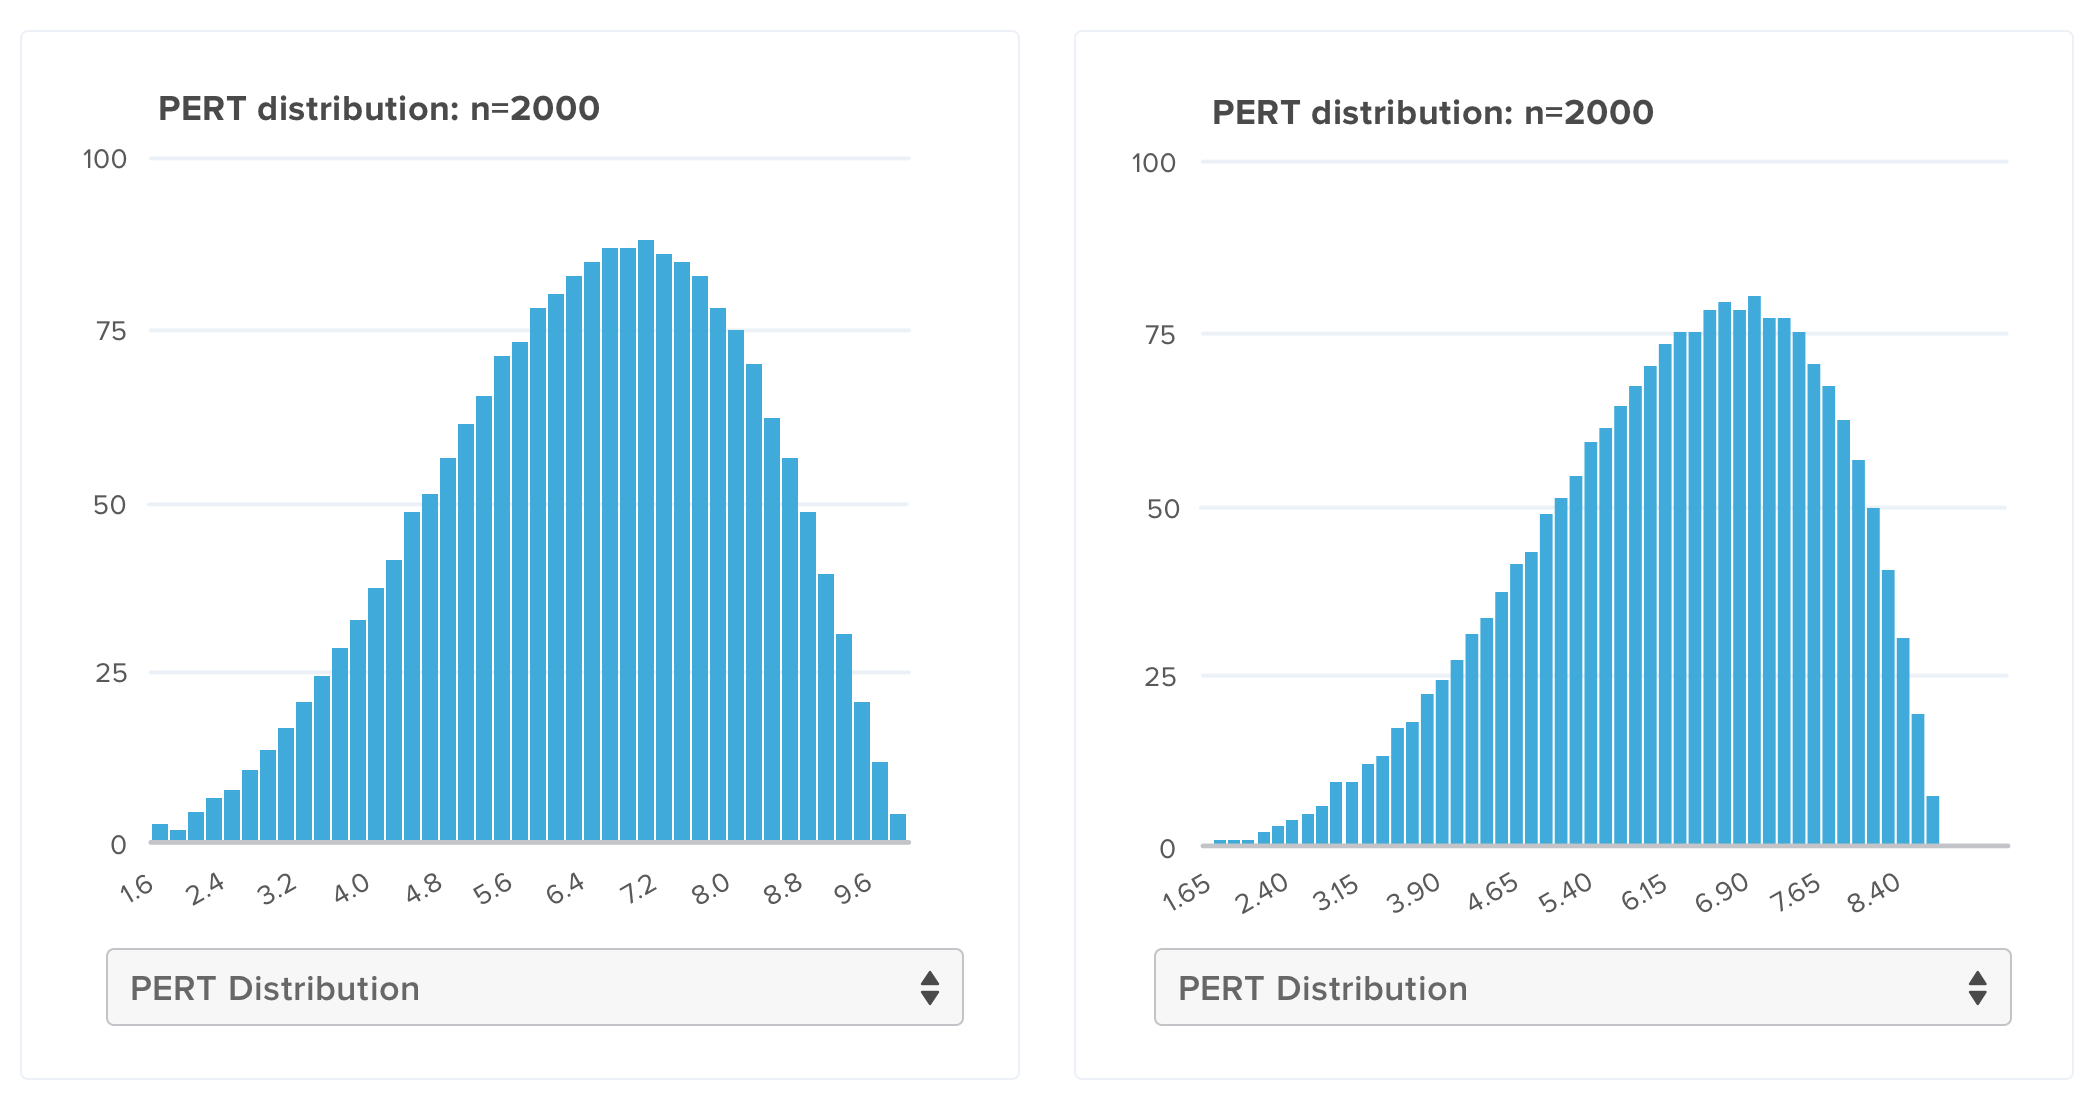
On the y-axis we have the probability to complete an x-axis amount of effort. The first graph (when the best case equals 10) is showing an almost-normal distribution, this is what you may call an optimistic estimate. However, I personally like to assume that most of our teams will be affected by the student syndrome so I always try to make my graph look like a left skewed PERT. That’s why I started changing the best case value, until I found that using 9 as best case, moved the density graph a little bit to the right (looking similar to a Student Syndrome graph). Given a best case equal to 9, the result will be:

Note: In this case, the difference may look insignificant but, in reality, you’ll have greater values and dispersion, thus you’ll see major changes.
Expected Time
We already have the amount of required effort and velocity to complete a specific part of that effort in a sprint. Now we just need some basic math to get the actual time.

Using the values from our example, the project would take 5.85 sprints to complete. If we assume that each sprint has a duration of 2 weeks, we can finally create a schedule:

Note: Always use a ceiling function, because realistically, you don’t work 11.7 weeks.
Also, try to put the weeks you’ve just calculated on a calendar. A classical error is that people assume this time as an absolute. In reality, starting in December is not the same as starting in March: Remember that you will have to work around public holidays and employee leave periods. That’s why it’s super important to choose an expected start date and define detailed roadmap for each consecutive week.
Step 4: Cost estimation
Min(Cost)
Average Cost per month
The time we just calculated is vital for the cost estimation but first, we need to define the frequency of our expenses, i.e weekly, monthly, quarterly, or the like. Here’s the equation for the total cost:

I’m going to use a month-based granularity as an example, because that’s the most common use-case. The total cost is then the product of the average cost per month and the amount of total months. The most common pitfall that I have seen in software projects is that the only cost considered was the developers’ salary and that’s wrong. That’s why I define this basic equation to obtain the most common costs:

Let’s try to understand these in detail.
Development Cost

The development cost involves elements like developers, designers, architects, IT crew and managers. Basically, anyone directly related to the product development. Salaries of supporting people like HR members, recruiters, secretaries, etc will be considered in other costs because often, they are shared between projects.
Note: When calculating development costs, don’t forget about the taxes or deductions that you need to pay as an employer.
We always need to have a backup plan for potential issues we might encounter. As a general rule, all costs need a buffer. Some common risks to take into account include:
- Unexpected leaves: Maternity leave, injury leaves, family leaves, etc
- Resignations
- Death
- Real salaries being greater than expected salaries (maybe for ignorance in the area or lack of resources you estimated this wrong)
- Team velocity is not high enough, you need more developers
Tips
-
An easy way to calculate a buffer is to define the maximum amount of salary that you will pay and the amount of possible new members that you may need in case of low team performance or another materialised risk.
-
Define a minimum and maximum amount of time to take actions. For instance, if the performance is not good by the end of month x, you will hire someone new.
Infrastructure Cost

From offices to servers, the infrastructure cost should ensure our human resources count with all the equipment and physical infrastructure to perform adequately. Some costs that you should have in mind are:
- IT infrastructure: Servers, disks, licenses, support services, cloud services, backups etc. - How many environments do you need? How do you expect the deployment architecture to be? Cloud or on-premise? Electricity costs?
- Internet: Provider cost, routers, switches - According to the amount of developers, is the bandwidth enough?
- Offices: Rental, desks, parking, fan/air conditioner, security
- Equipment: Screens, computers, peripherals
- Others: Food, drinks
Common risks in this category are:
- IT price changes
- Licences changes (especially for monthly services)
Tips
Managing these risks is almost impossible. However, I do have two recommendations:
- Acquire upfront packages if possible. If you know that your project will last one year or ten months, buying upfront packages reduces costs most of the time and guarantees fixed prices.
- Talk with your providers and ask them about specials and packages. If companies assign you an account manager, you will always have someone to help you in case of price changes.
Travel and Transport Costs

Travel costs don’t apply to all projects but are often forgotten when they shouldn’t be. If you’re working with remote clients or remote workers, travel and transport costs could be:
- Flights per member
- Public transport per member
- Fuel expenses
- Accommodation and food
- Third party flights (like trainees)
- Travel insurance per member
In this case, common risks are:
- More trips than expected
- Surprise/last minute trips
- Rate changes
Tips
Travel costs could become a headache if you haven’t thought about them from the start. That’s why I recommend to:
- Define all the meetings with your client or remote members from the beginning, even if you don’t have specific dates yet. Try to set at least date ranges and the amount of key meetings.
- Buy enterprise packages with airlines or gateways. Buying on demand tickets is always risky: you may not find your desired flights or they’re ridiculously expensive.
Support and Financial Cost

We all know that lawyers and financial advisors are not cheap, so always keep them in mind during your estimation process. The most common ones are:
- Attorneys hours
- Financial Advisors Hours
Don’t forget that a common risk includes encountering unexpected legal issues during your project. This risk is highly unpredictable.
Tips
Having an internal financial and legal team is a good way to reduce the probability of extra costs. If you’re a small to mid-sized company, you could create financial packages with partner companies, so that you share the same financial and legal advisors.
Other Costs
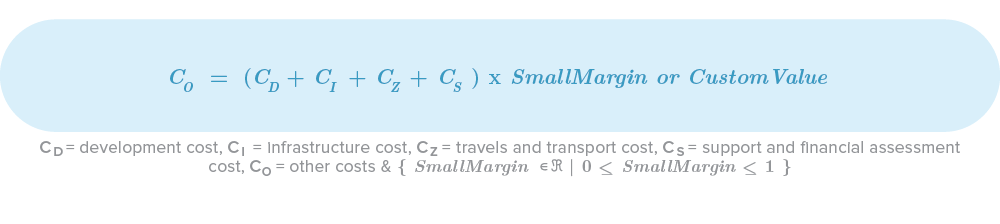
I like to call these costs “The ones we always forget (other than transport costs)”. We are often so focused on the project itself that we forget all the small things that we use and need in our day-to-day. Some of those costs are:
- Stationery: paper, notebooks, pens, markers, clips, sticky notes, etc
- Printing
- White boards
- Shared salaries: secretaries, HR, domestics, guards, etc
Some common risks are:
- Not enough stationary elements
- You figured out that you needed dedicated resources instead of shared
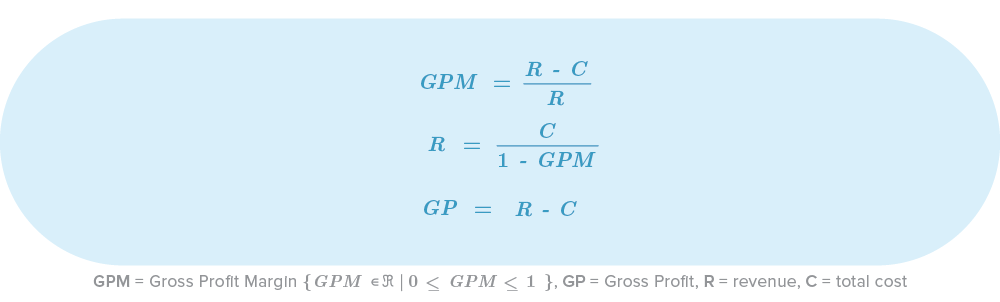
Gross Profit
As a business, you should have an Expected Gross Profit Margin (GPM). Depending on the project and industry, expected GPMs might be between 20% and 35%.
Based on the GPM and Total Cost, we can then define our Gross Profit. Take a look at the following formulas:
Taxes
Every single country has different ways to manage taxes, so I’m not going to explain this topic in depth, but in general terms, you need to multiply your tax base (Cost + GP + Contingency Buffer) with your tax rate.
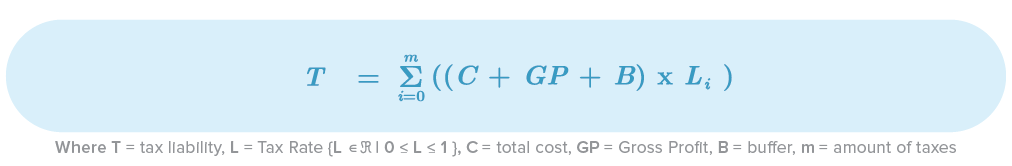
Tips
If multiple taxation/liability applies to your tax base and they are not part of your client’s bill, replace Li with Li / 1 - Li. That’ll help you to obtain the real value of your tax rate (like your expected liability).
Step 5: The Total Value of your Project
Finally, the total value of your project, the one that you are going to present to your client, team and directives, is defined by:

Going Forward
I really hope this article is going to be useful for your future projects. In this article I explained some of the basic concepts, formulas and methods of project estimation that I’ve used in the past. I didn’t expect to present or cover every aspect of software estimation, since this is a field that takes years and years of practice. There are engineers whose only job is to do this! I’ve met people whose Ph.D thesis are just about estimation methods or tools for specific cases or business. If you are willing to learn more about this topic, take a look at:
- Software Estimation: Demystifing the Black Art — Steve McConnel
- Agile Estimating and Planning — Mike Cohn
- Estimating Software-Intensive Systems: Projects, Products, and Processes — Richard Stutzke
Relative estimation
- Why is the pseudo Fibonacci scale a good scale?
- The benefits of using story points
- Planning Poker explanaition
Simulation with MonteCarlo and Risk software
Using Neural networks

This article was written by Juan Urrego - Software and solutions architect with thorough hands-on experience of software engineering, software architecture and agile development. He has entrepreneur, IT consulting and university lecturer experience with high emphasis and interest in AI and machine learning.
We have started collaborating with South African software makers to share their insights, learnings and ideas on the blog. If you have an interesting topic in mind and are keen to write with us, please get in touch!