Debugging is an art form. Often, it feels like you need a series of serendipitous insights to fix a complicated bug. In reality, you need two things: technical knowledge to spot broader patterns and connections, and data on the bug itself to understand the problem. In this article, I’ll show you how Google Chrome’s Developer Tools can help you fix JS and HTML/CSS bugs fast.
A few years back, debugging a web page involved tons of manual hacks - including the dreaded alert statement, painful trial and error loops and so much time searching for the root cause that productivity seemed like an ever-far mirage. Thankfully, modern day browsers have built-in developer tools that make this process a lot easier and developers like me much happier. Chrome is my default browser, so I mainly use its DevTools but that’s not to say that other browsers don’t have nifty tools as well.
Finding JS bugs
Quickly spot and filter errors and warnings
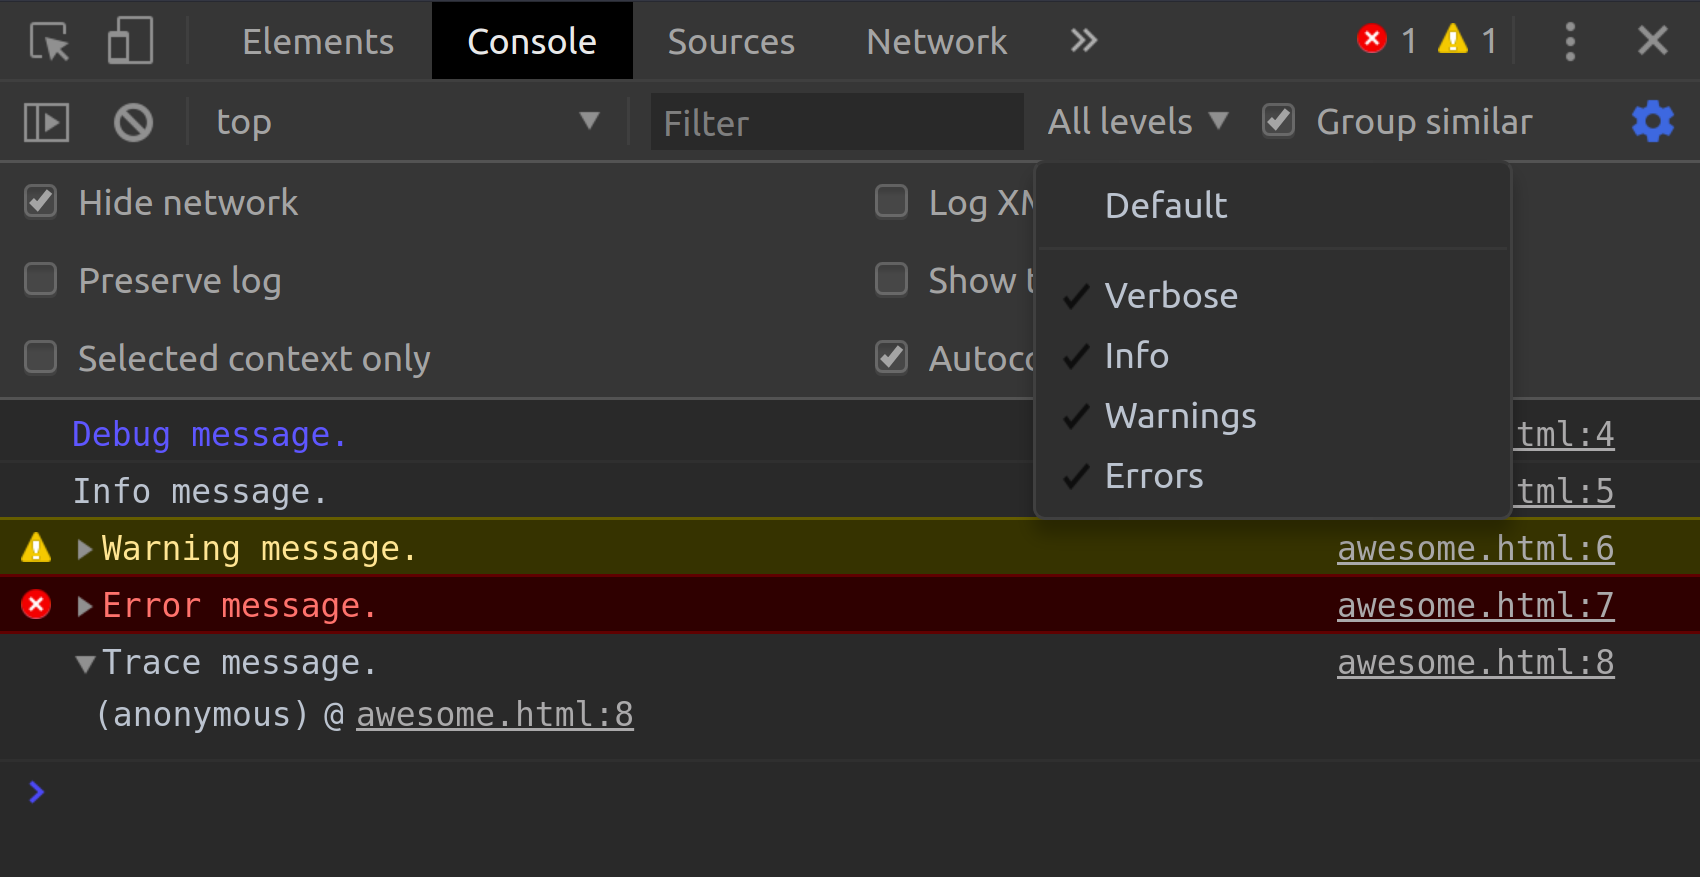
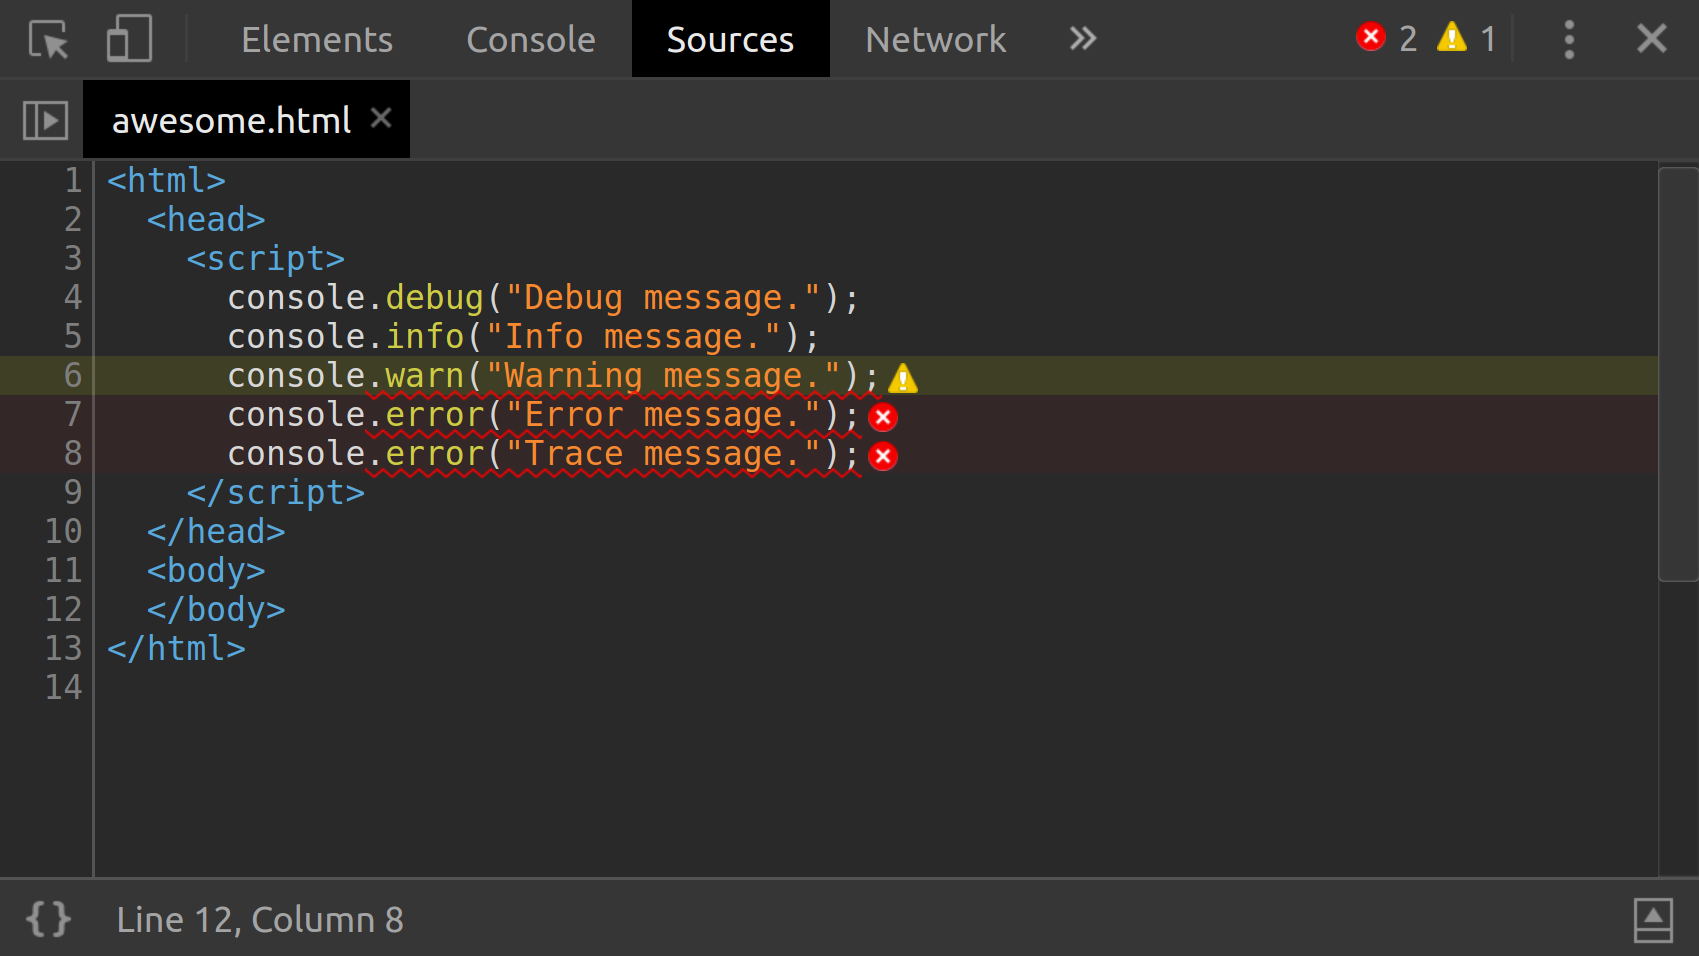
When my JS code isn’t working as expected, I immediately open Developer Tools (⌥+⌘+I on Mac, Control+Shift+I on Windows) and look for the Console panel. This is my go-to buddy when I want to see any messages that are logged from JavaScript code on the page. There are different types of messages: Verbose, Info, Warnings and Errors. For debugging, I am most interested in the latter two. I can quickly spot warnings by their yellow colour, and errors by their bright red.
Navigating messages
To filter the type of messages displayed in the console, I click the “All levels” drop-down list. If I have a good idea of what I am looking for, I can use the filter textbox to search for specific text.
The console bar is another useful way to navigate messages. It breaks down the number of messages that are shown for each level. It also lets me see them by file, which is especially useful for those that generate large numbers of messages.
If I want to clear up the noise of irrelevant messages even more, I open the console settings (the little gear icon to the right of the screen) so that I can hide network traffic. Now my logs ignore things like CDN failures, which aren’t directly relevant to the bug I’m looking at.
Trace the problem to its source
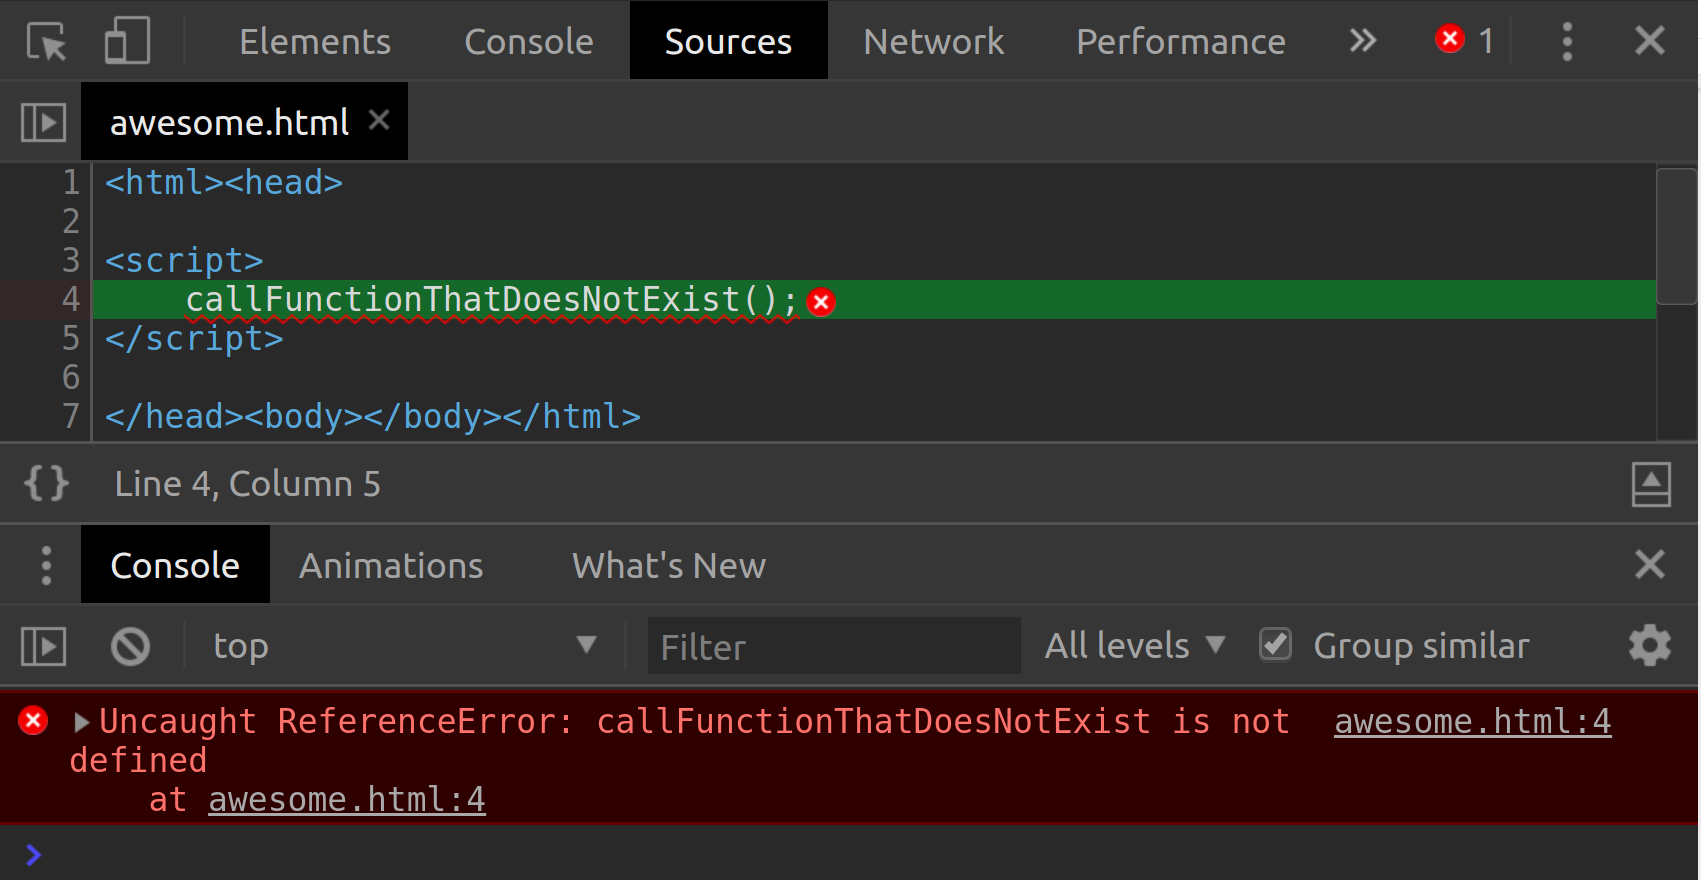
To the right of each warning and error message in the console is a link to the originating file and line number. To find the source of a bug, be curious and click on these links. They take me to the Sources panel, where I can see all files loaded by the page. This is a nice place to be!
Turn code into a human-friendly structure
When I click on a console message link, DevTools will take me to the exact line of JS code that resulted in an error. Unfortunately, if my JS code is ‘minified’, I’m just going to see one long line of code. This isn’t human-friendly. Fortunately, DevTools gives us a ‘pretty print’ feature to expand the code back into its original, human-friendly structure.
Now I am better equipped to fix the bug and save the page from its own demise. This is a luxury that I am grateful for, because it eliminates the arduous search for errors.
Pass debugging data from your code
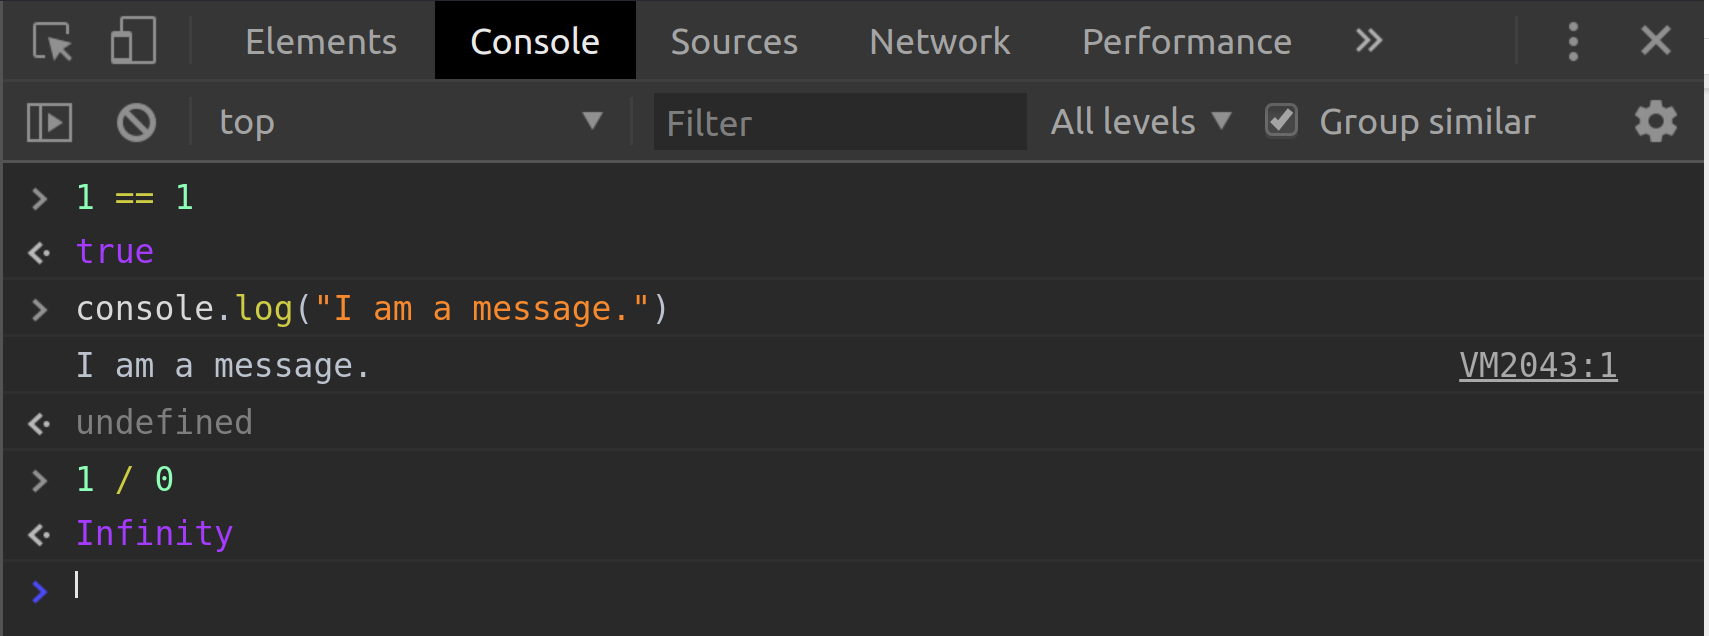
I can print my own messages to the console using the JS Console API. Essentially, if I add console.log(“hello world”) to my code, hello world will be printed to the console when that line executes.
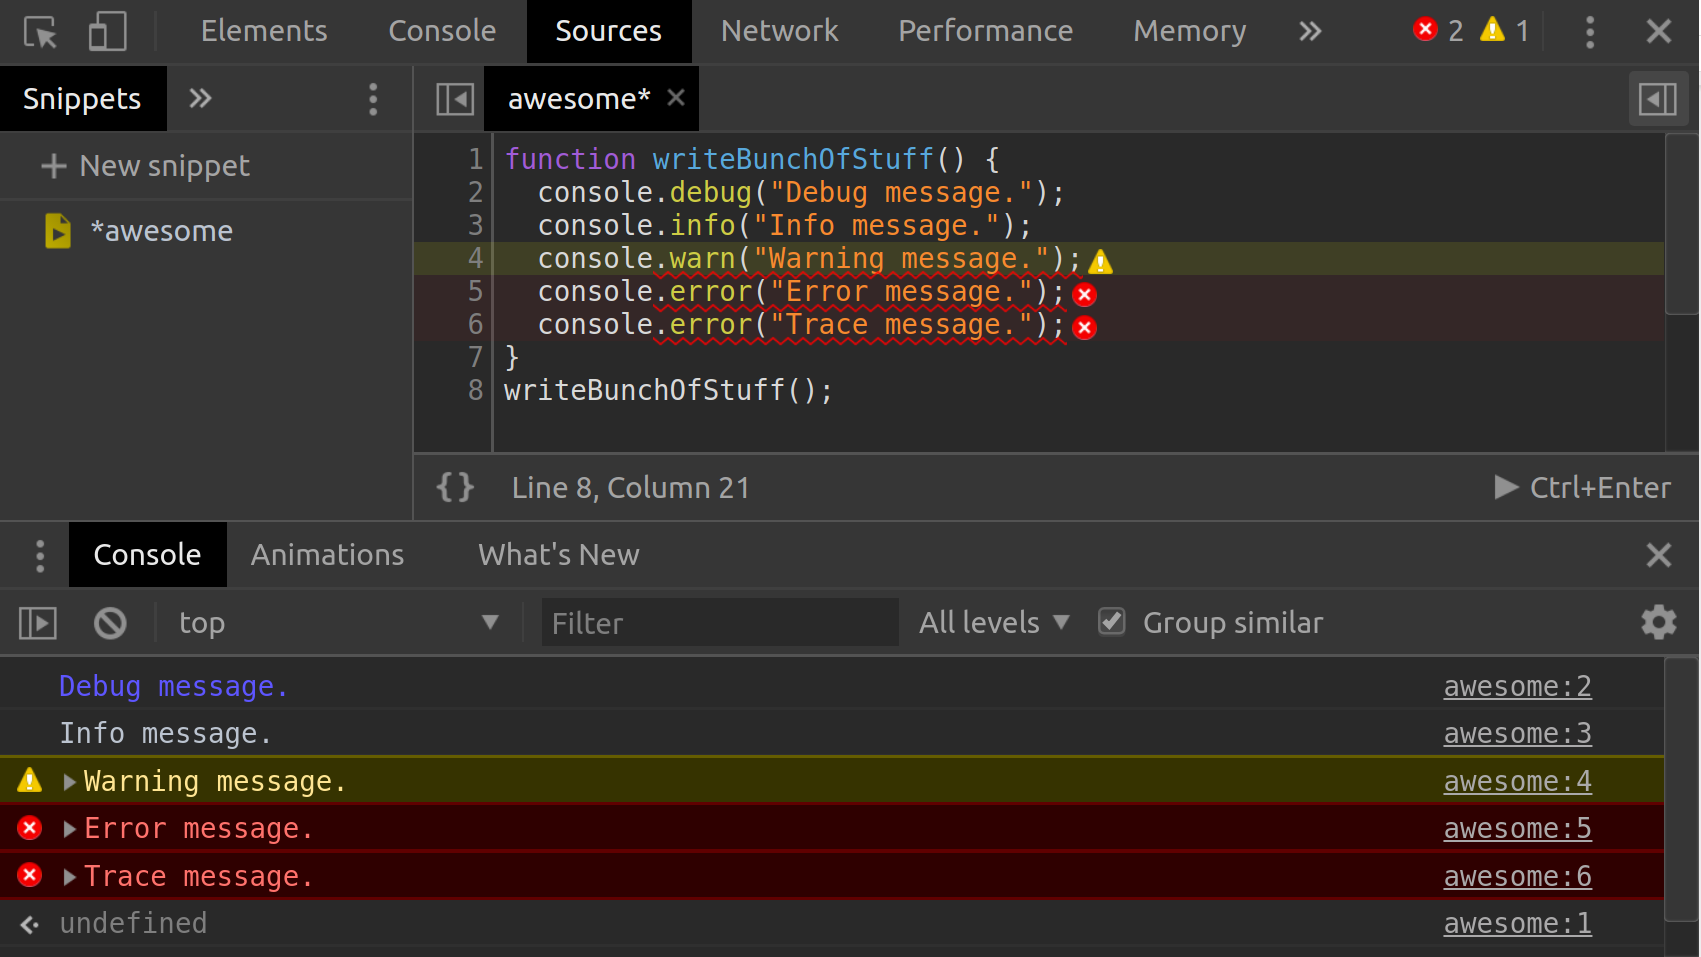
Another useful command I discovered recently is console.debug(), which prints a verbose message displayed in blue (unless you're screen-shotting on Linux - then they are veeeeeery very purple). I use these logs to create loquacious messages that help me debug my application and are hidden from the user by default.
I use console.error() when I need to display an “in-your-face” error message with a stack trace for something that went wrong.
console.trace() will print a stack trace from the point where the method was called. This will show you the exact functions that were called up to that point, and the order in which they were executed.
Execute JS in the browser without changing your code
If I want to run quick experiments and want instant input and output with access to everything on the page (e.g. DOM and cookies), I can execute JS code in the browser without changing my source code.
As you may know and have gathered from above, the Console allows you to write and submit JavaScript. This earns it a really cool acronym called the REPL (Read, Evaluate, Print and Loop). You can type single line, multi line (use SHIFT+ENTER) or paste code into the little terminal-like line available to you.
If you need to run a repetitive script as a utility or debugging mechanism, you can save it as a snippet. This functionality is nested away in the Sources panel and are called Snippets. To access it you need to either expand the panel by dragging it to the right or simply click on the double right arrow on the top right by the columns.
Clean up the console
Once I have found what I am looking for, or if I want a clean slate, I can clear the console history using the clear icon or by typing clear() statement in the console.
Unravel styling problems
“Stack trace” CSS issues
Have you ever come across a missing element or an element floating off into the blue yonder, maybe an element that cannot be clicked on or is bouncing around when something else is clicked? We all know the familiar feeling of a misaligned <div> or an odd-looking button. Back in the day, if I wanted to investigate these visual anomalies, I’d have to correlate the output code with my source code and manually find the error, try fix it and refresh the page in the browser. There used to be a lot of rinsing and repeating.
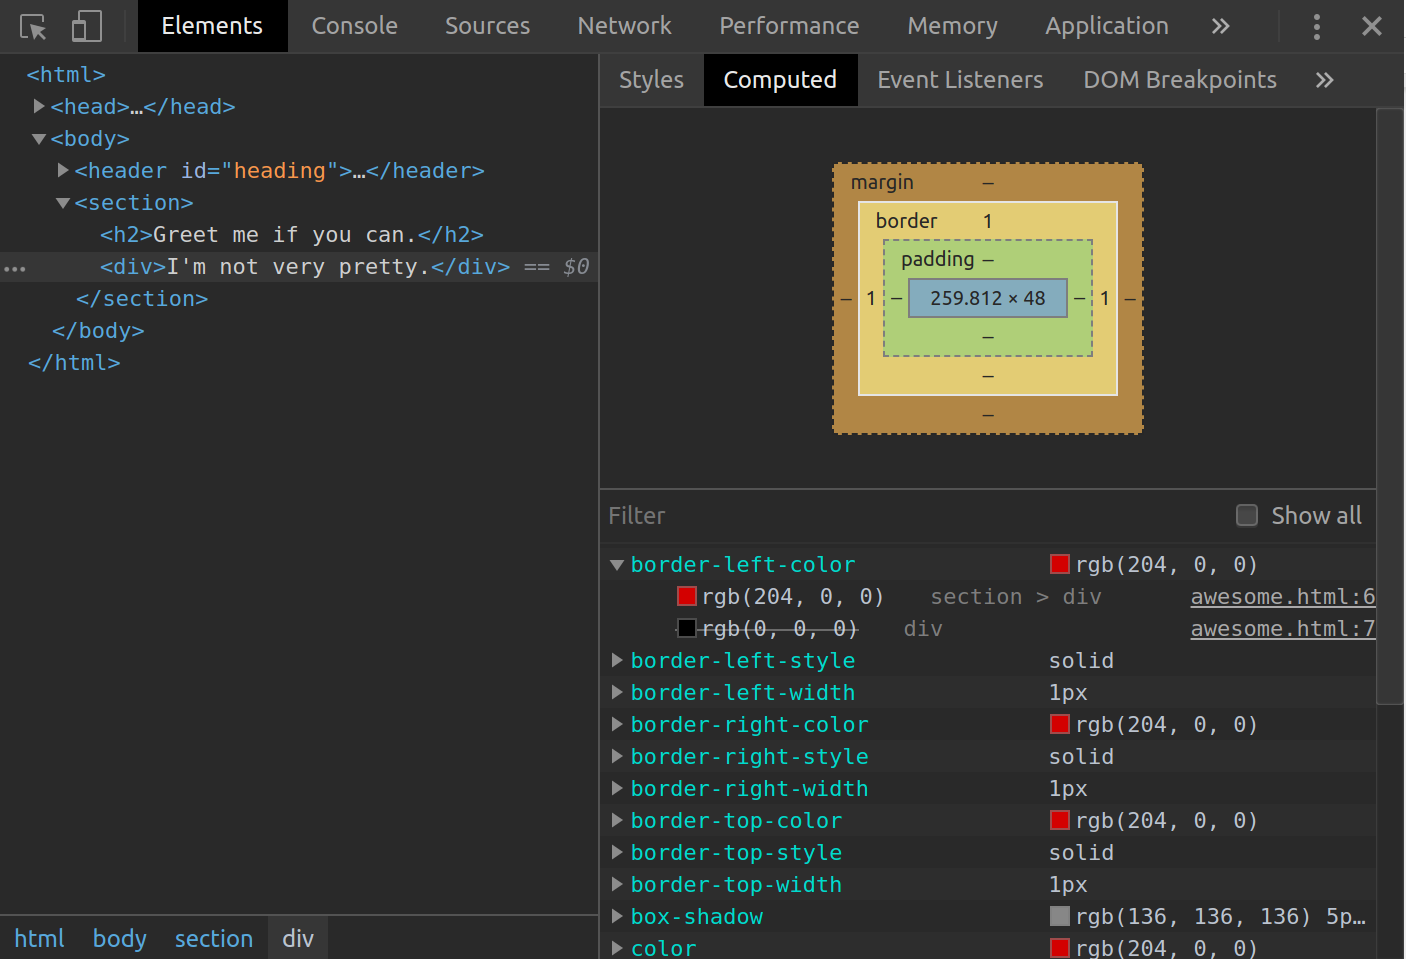
Fortunately, nowadays I can give my brain some rest: I simply right-click on the troublemaker element, click Inspect Element and then shift my focus to the Elements tab. Next, I look at the Styles panel to see all CSS rules for that element. There seems to be many attributes for this element, its class and identifier. The strikethrough text indicates classes that have been overridden. I monotonously scroll through a panel of checkboxes and wonder where I should start?
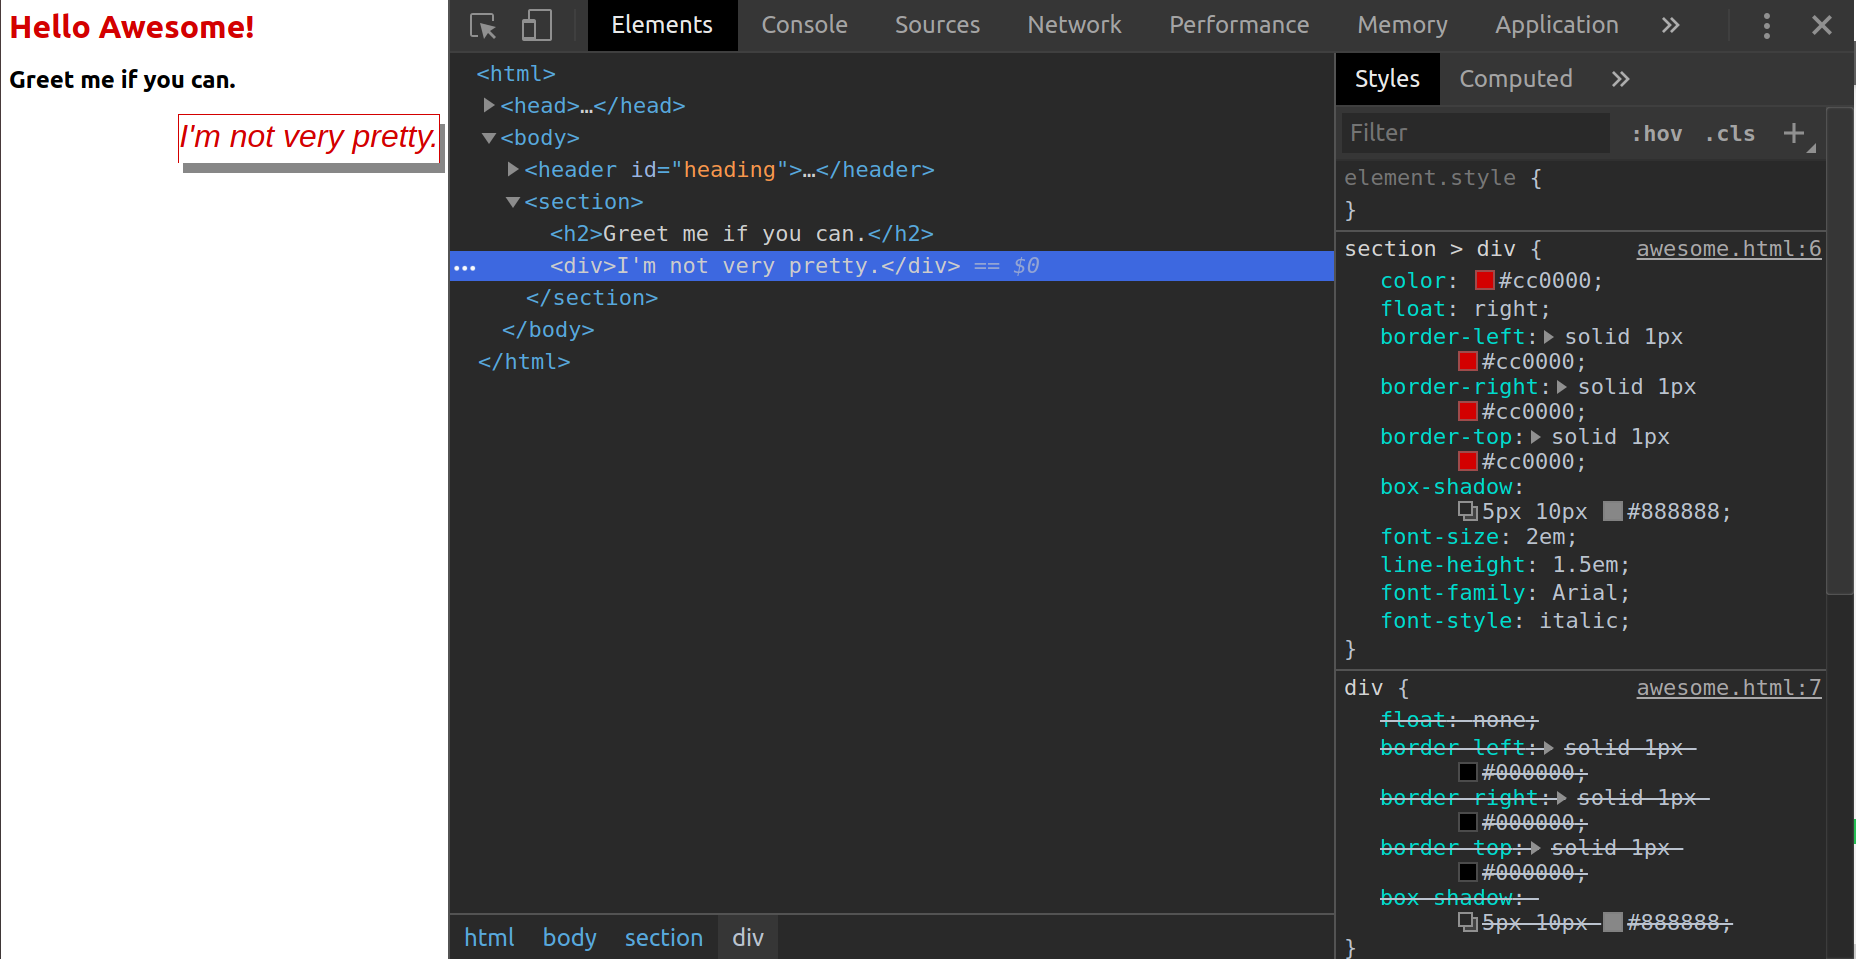
I rather shift my focus to the Computed panel. This gives me a unique breakdown of all custom configured styles. When I expand a style, I get a list of all places it has been styled, i.e. a “stack trace”. When I click on one I will jump back to that style change in the Styles panel giving me a better idea of what is happening and where. This better equips me to spot styling anomalies, which I have learned through experience.
Do live experiments
Now that I’ve identified the problem, I’m ready to start playing in the land of the DOM and its styling. I’ll be here a while, so I grab some coffee and make sure my Developer Tools layout is set: I dock the tools in one of three ways to maximise my screen real estate for debugging. I switch between right, bottom and undocked depending on what I am doing at that time which comes with preference and comfort. Undocked is great if you have a second screen.
Experiment time! What will happen if I change the <div> element to a <span>? I do this by double-clicking on the <div> text on the DOM node. I change it to the <span> and watch Chrome automatically update the closing tag.
Now I want to change the styling of another <div>. Say I want to change its z-index. It shouldn’t be so high. I click on the <div> and turn towards the Styles section. I click on the z-index value and press up and down to change its behaviour. I could also add a new style by clicking on the plus button and change the background colour to have a visual confirmation of change. Once I am happy with a given setting and have given it some thought, I can add the value to the CSS and test it again.
Pro tip: Executing document.designMode = “on” in the console will let you click and type anywhere you want on your page. This is helpful if you want to experiment with text directly on the page instead of in the DOM.
All of this saves me time, because I can run multiple styling experiments in the browser before copying my resulting code back to my source file.

Clarice Bouwer is a curious web generalist and ChromeDevTools-enthusiast who's learned that the bigger picture is about people. You can catch her on Twitter or her blog.